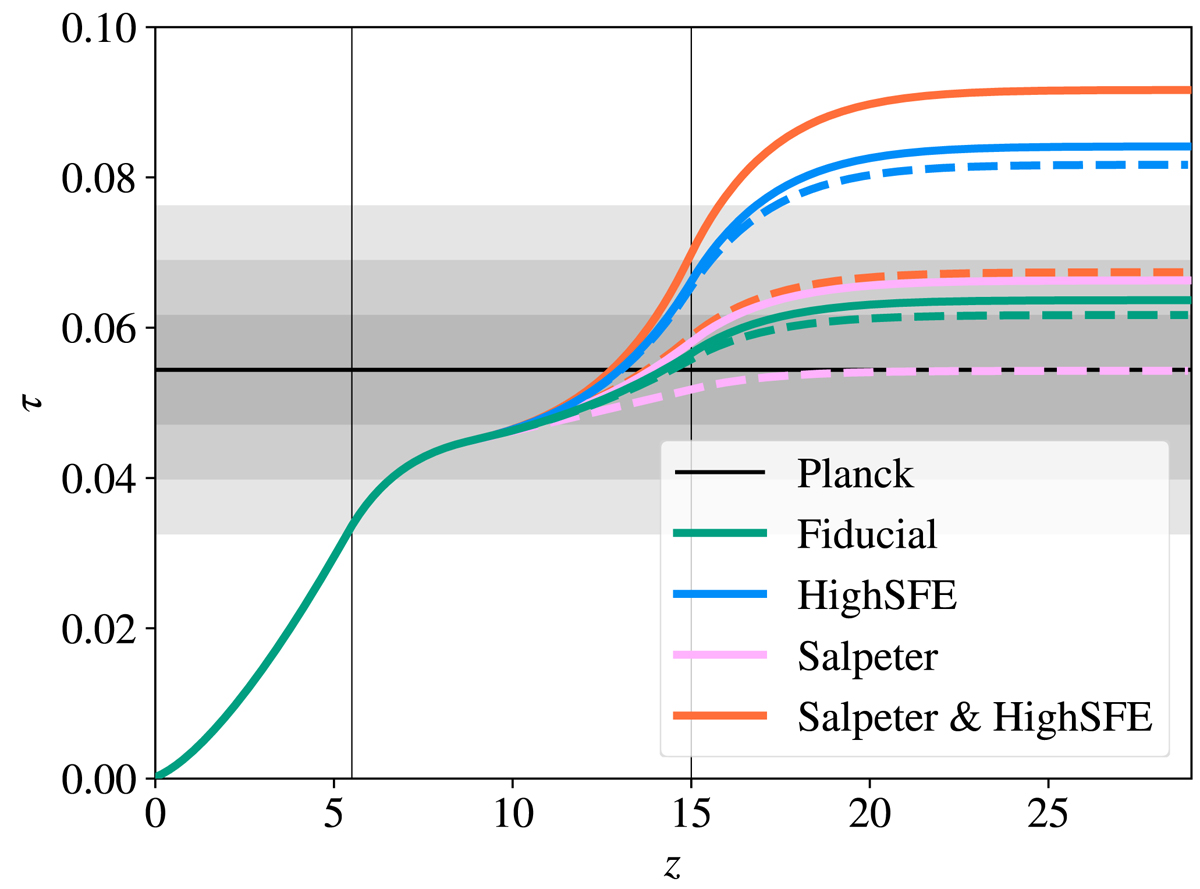
Fig. 9.
Download original image
Optical depth to Thomson scattering, based on the extrapolation of the predicted ionisation histories from our CHE and GENEC models (see Fig. 8). The recent measurement by Planck (Planck Collaboration I 2020) is shown with the horizontal line, whose 1, 2, and 3σ scatters are denoted by the shaded regions. Again, the vertical lines show the redshift range (z ∼ 5.5 − 15) in which our predictions at high-z are extrapolated to the post-reionisation epoch.
Current usage metrics show cumulative count of Article Views (full-text article views including HTML views, PDF and ePub downloads, according to the available data) and Abstracts Views on Vision4Press platform.
Data correspond to usage on the plateform after 2015. The current usage metrics is available 48-96 hours after online publication and is updated daily on week days.
Initial download of the metrics may take a while.