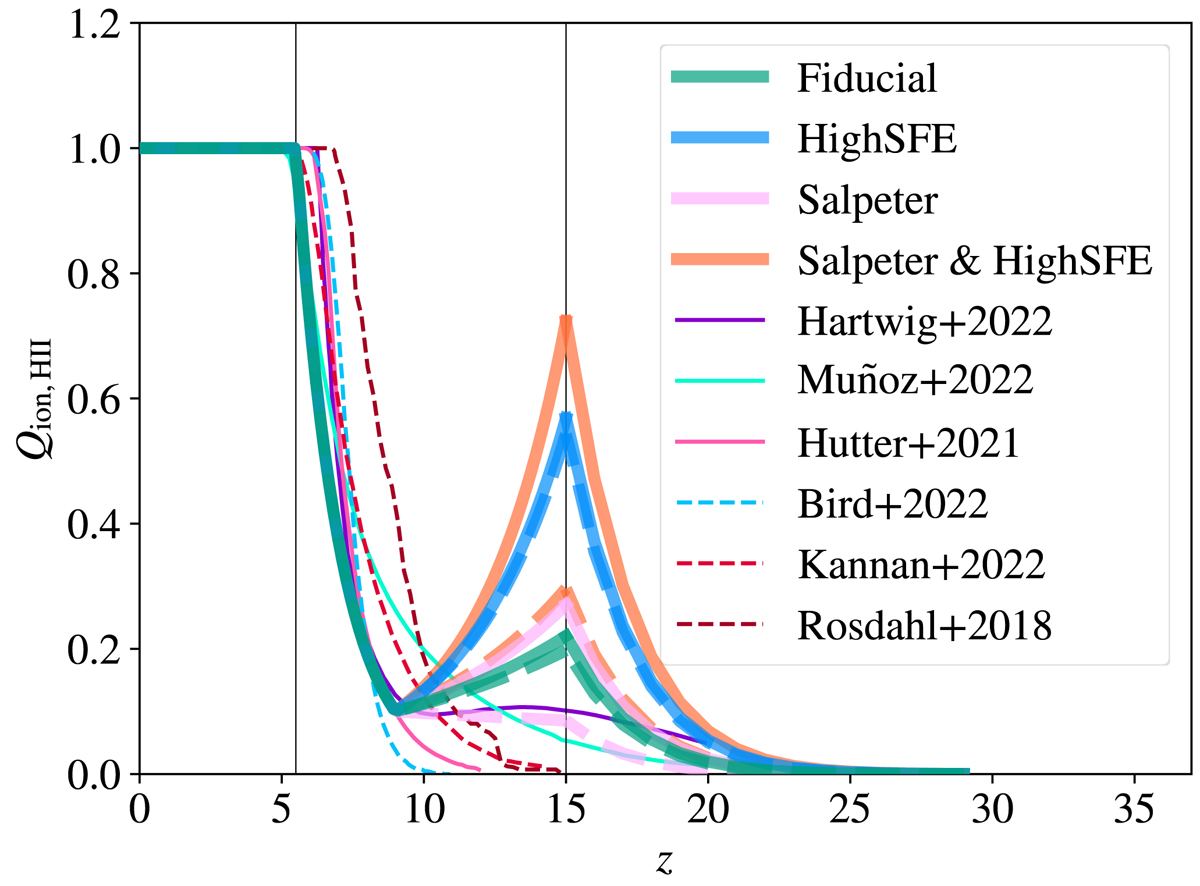
Fig. 8.
Download original image
Ionised fraction of hydrogen. Extrapolation of the predictions (at z ∼ 15 − 30) from our CHE and standard models are shown with thick solid and dashed curves. For comparison, we plot the results from the semi-analytical models ASLOTH (Hartwig et al. 2022), 21cmFAST (Muñoz et al. 2022) and Astraeus (Hutter et al. 2021), as well as cosmological simulations ASTRID (Bird et al. 2022), THESAN (Kannan et al. 2022) and SPHINX (Rosdahl et al. 2018) with thin solid and dashed curves, respectively. The vertical lines show the redshift range (z ∼ 5.5 − 15) in which our predictions at high-z are extrapolated to the post-reionisation epoch.
Current usage metrics show cumulative count of Article Views (full-text article views including HTML views, PDF and ePub downloads, according to the available data) and Abstracts Views on Vision4Press platform.
Data correspond to usage on the plateform after 2015. The current usage metrics is available 48-96 hours after online publication and is updated daily on week days.
Initial download of the metrics may take a while.