Open Access
Fig. 1.
Download original image
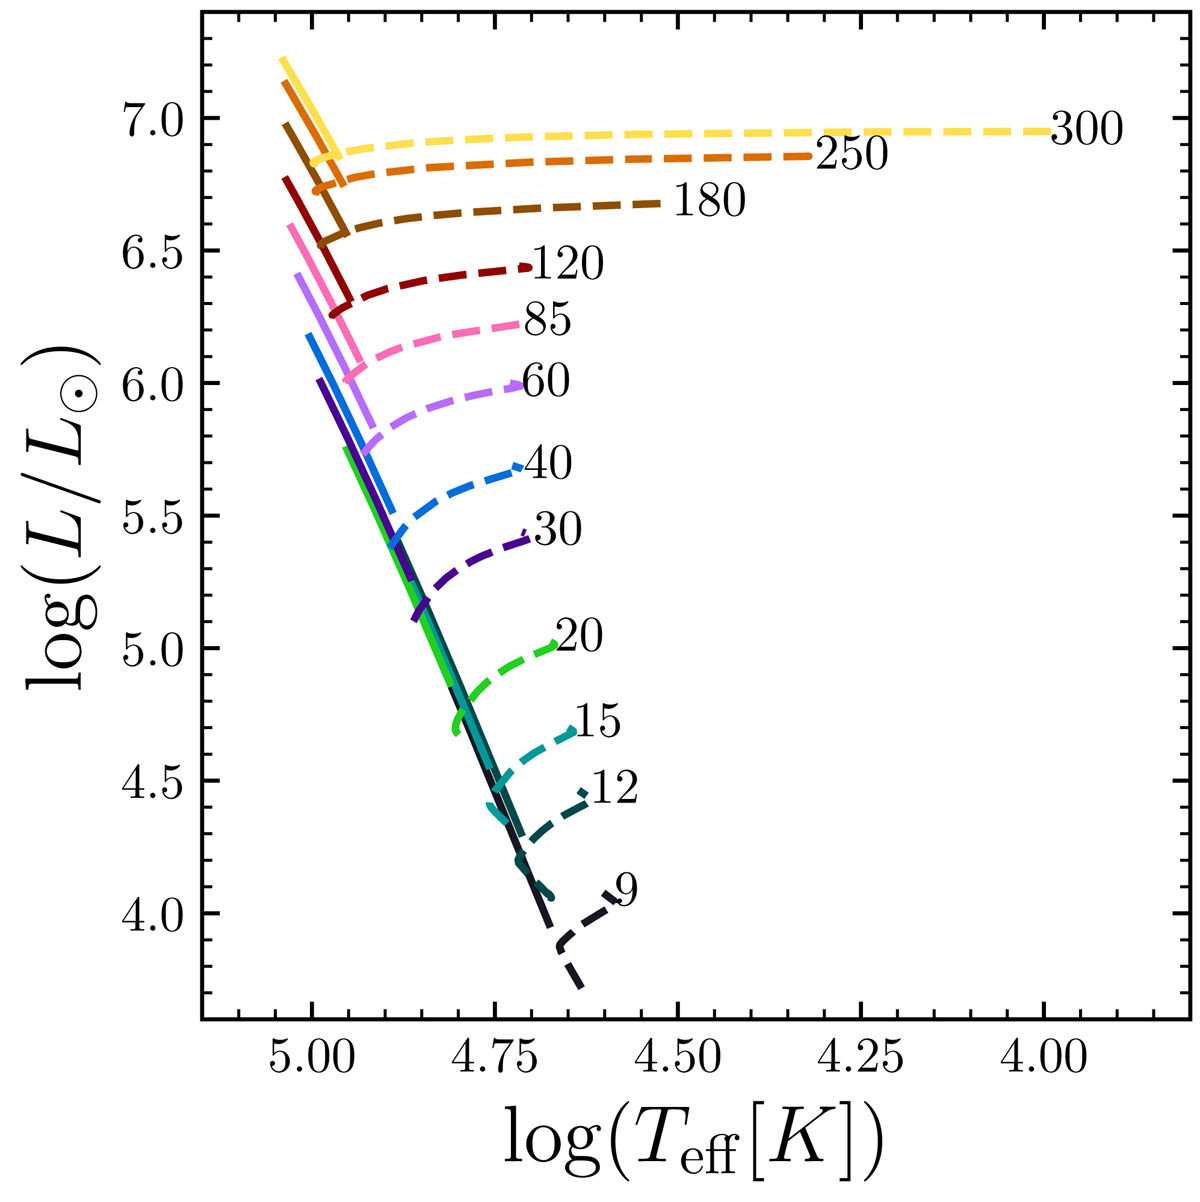
HR diagram showing the MS evolution of the Pop III chemically homogeneous models (solid lines) and that of the Pop III standard models computed with GENEC by Murphy et al. (2021, dashed lines). The numbers indicate the initial mass in M⊙ of each model.
Current usage metrics show cumulative count of Article Views (full-text article views including HTML views, PDF and ePub downloads, according to the available data) and Abstracts Views on Vision4Press platform.
Data correspond to usage on the plateform after 2015. The current usage metrics is available 48-96 hours after online publication and is updated daily on week days.
Initial download of the metrics may take a while.