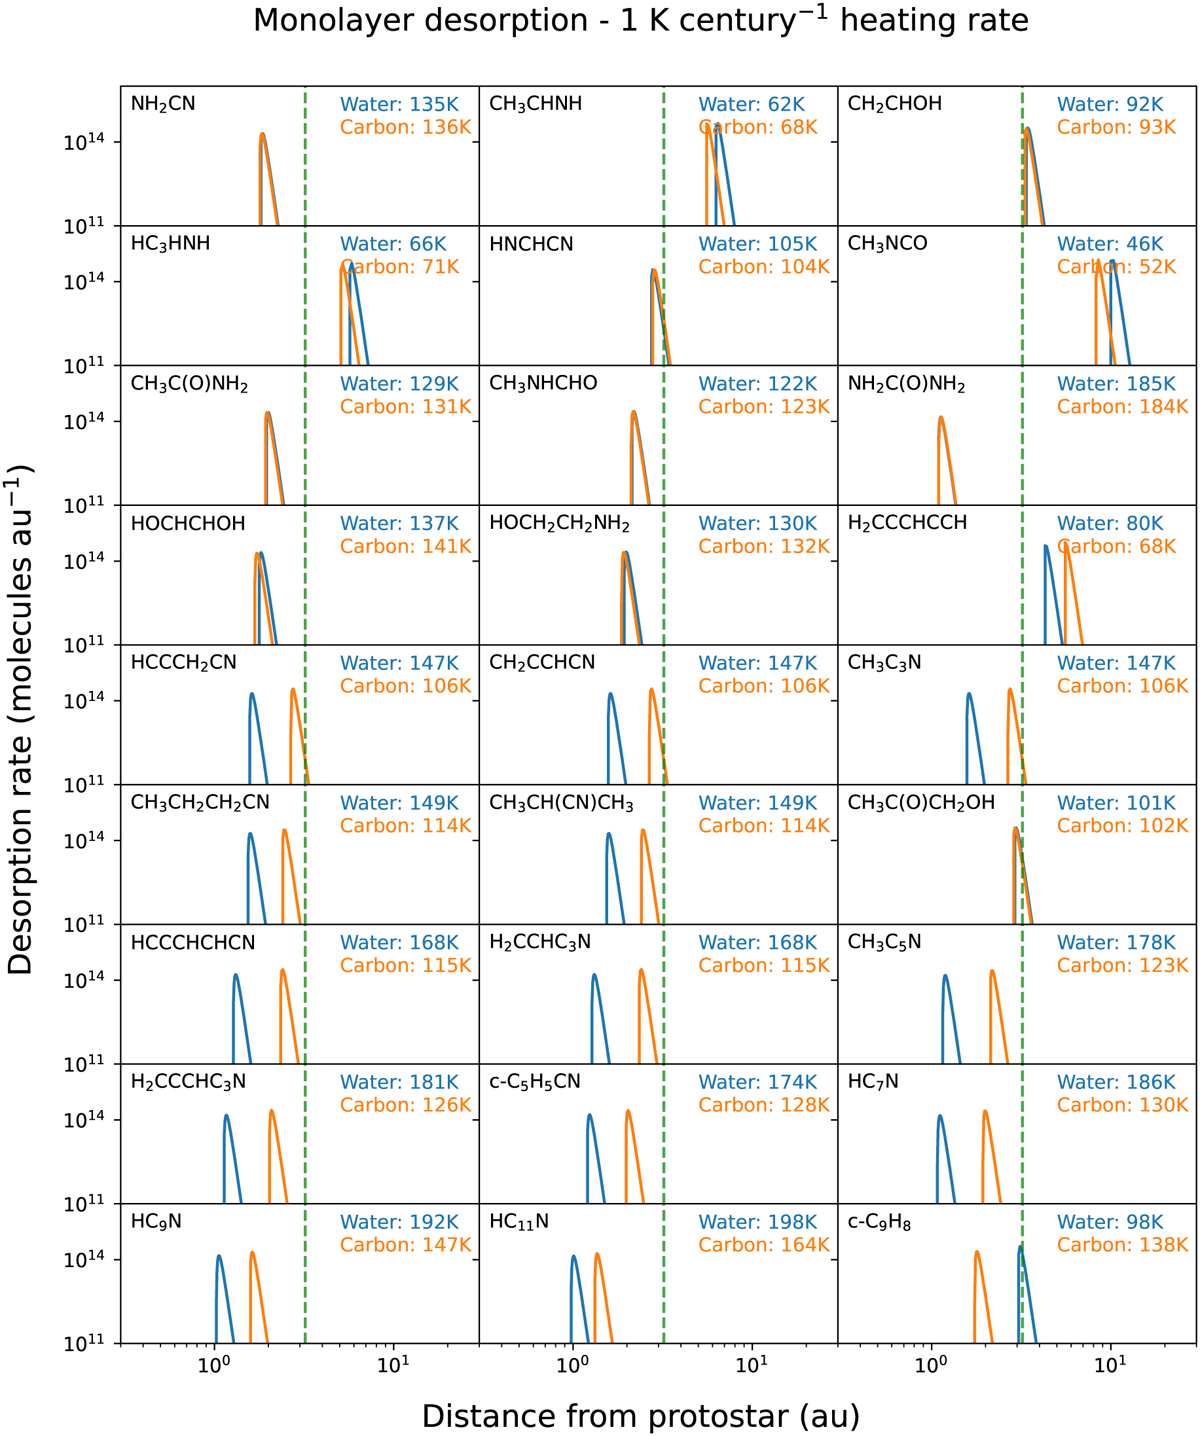
Fig. 4
Download original image
Same as Fig. 3, except that the desorption trace is plotted against a median disk temperature profile as derived by Andrews & Williams (2007); see main text for more details. Shorter distances are closer to the protostar and thus correspond to higher temperatures. The peak desorption for water is indicated with a green dashed lines at 3.2 au.
Current usage metrics show cumulative count of Article Views (full-text article views including HTML views, PDF and ePub downloads, according to the available data) and Abstracts Views on Vision4Press platform.
Data correspond to usage on the plateform after 2015. The current usage metrics is available 48-96 hours after online publication and is updated daily on week days.
Initial download of the metrics may take a while.