Fig. 3
Download original image
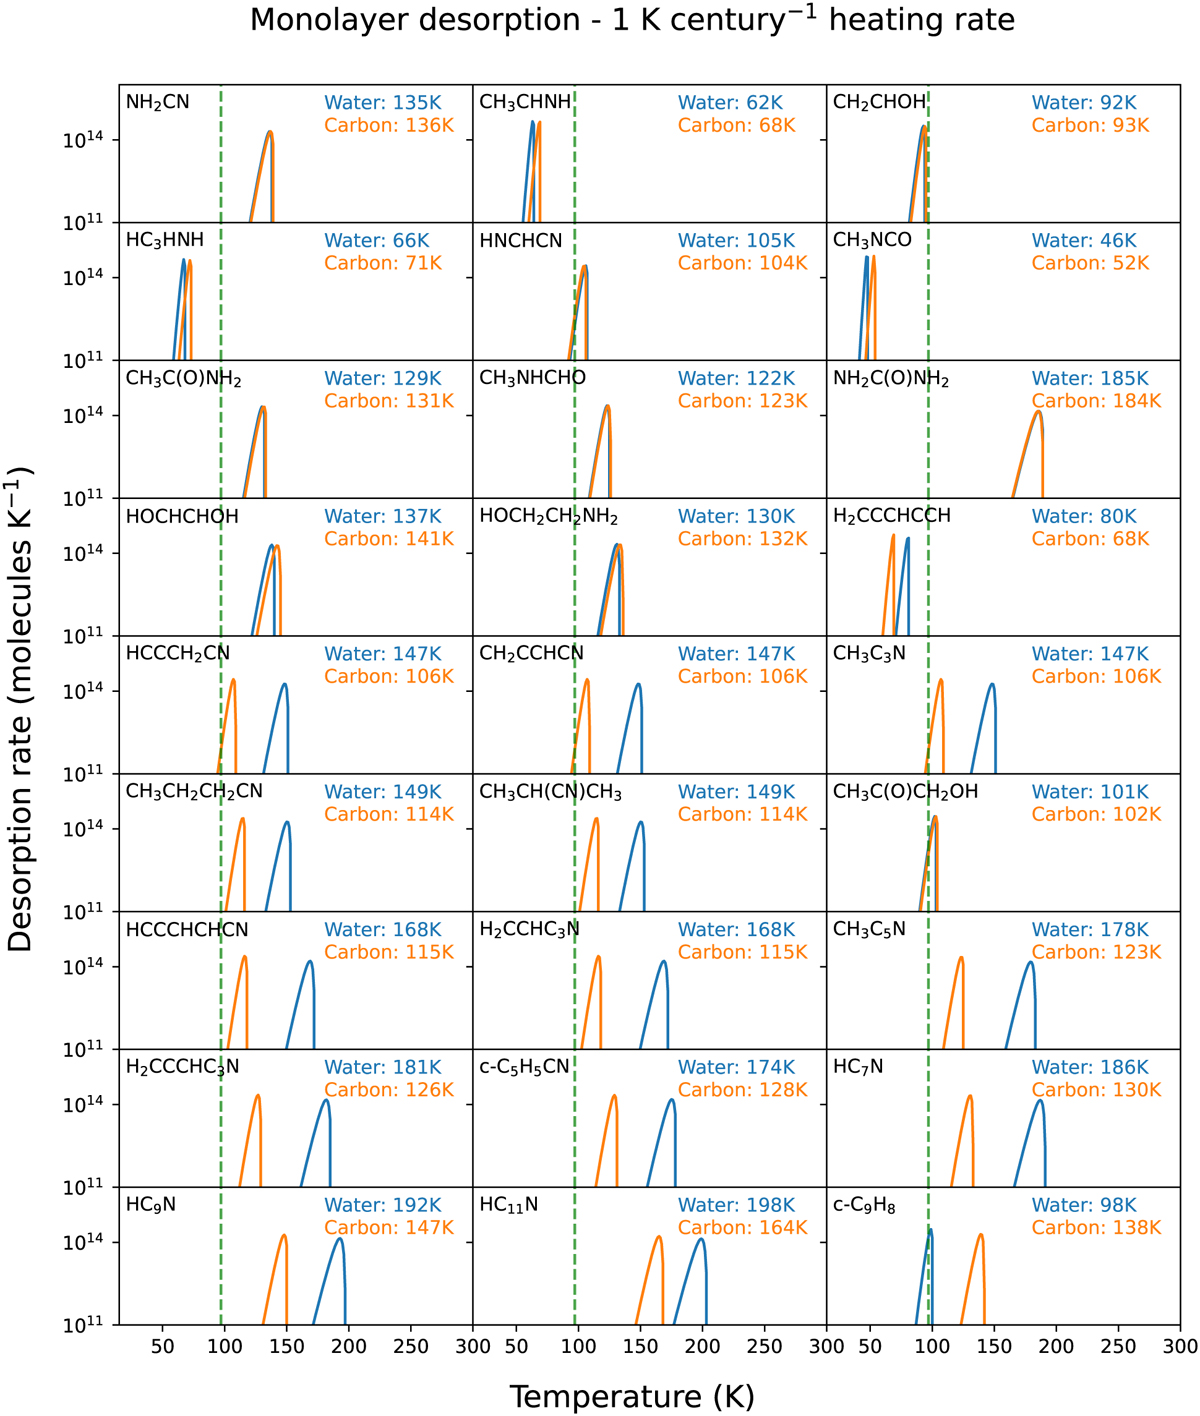
Desorption traces of molecules for which the BE is determined in this work. The first-order desorption profiles are plotted for monolayer (1 × 10¹⁵ molecules cm−2) coverage on a water ice (blue) and carbonaceous (orange) surface. The peak desorption temperatures are indicated in the top right corners. A linear heating rate of 1 K century−1 is applied. Prefactors are assumed and set at A =1 × 10¹⁸ s−1 for all molecules. The peak desorption for water is indicated with a green dashed lines at 97 K.
Current usage metrics show cumulative count of Article Views (full-text article views including HTML views, PDF and ePub downloads, according to the available data) and Abstracts Views on Vision4Press platform.
Data correspond to usage on the plateform after 2015. The current usage metrics is available 48-96 hours after online publication and is updated daily on week days.
Initial download of the metrics may take a while.