Fig. 5.
Download original image
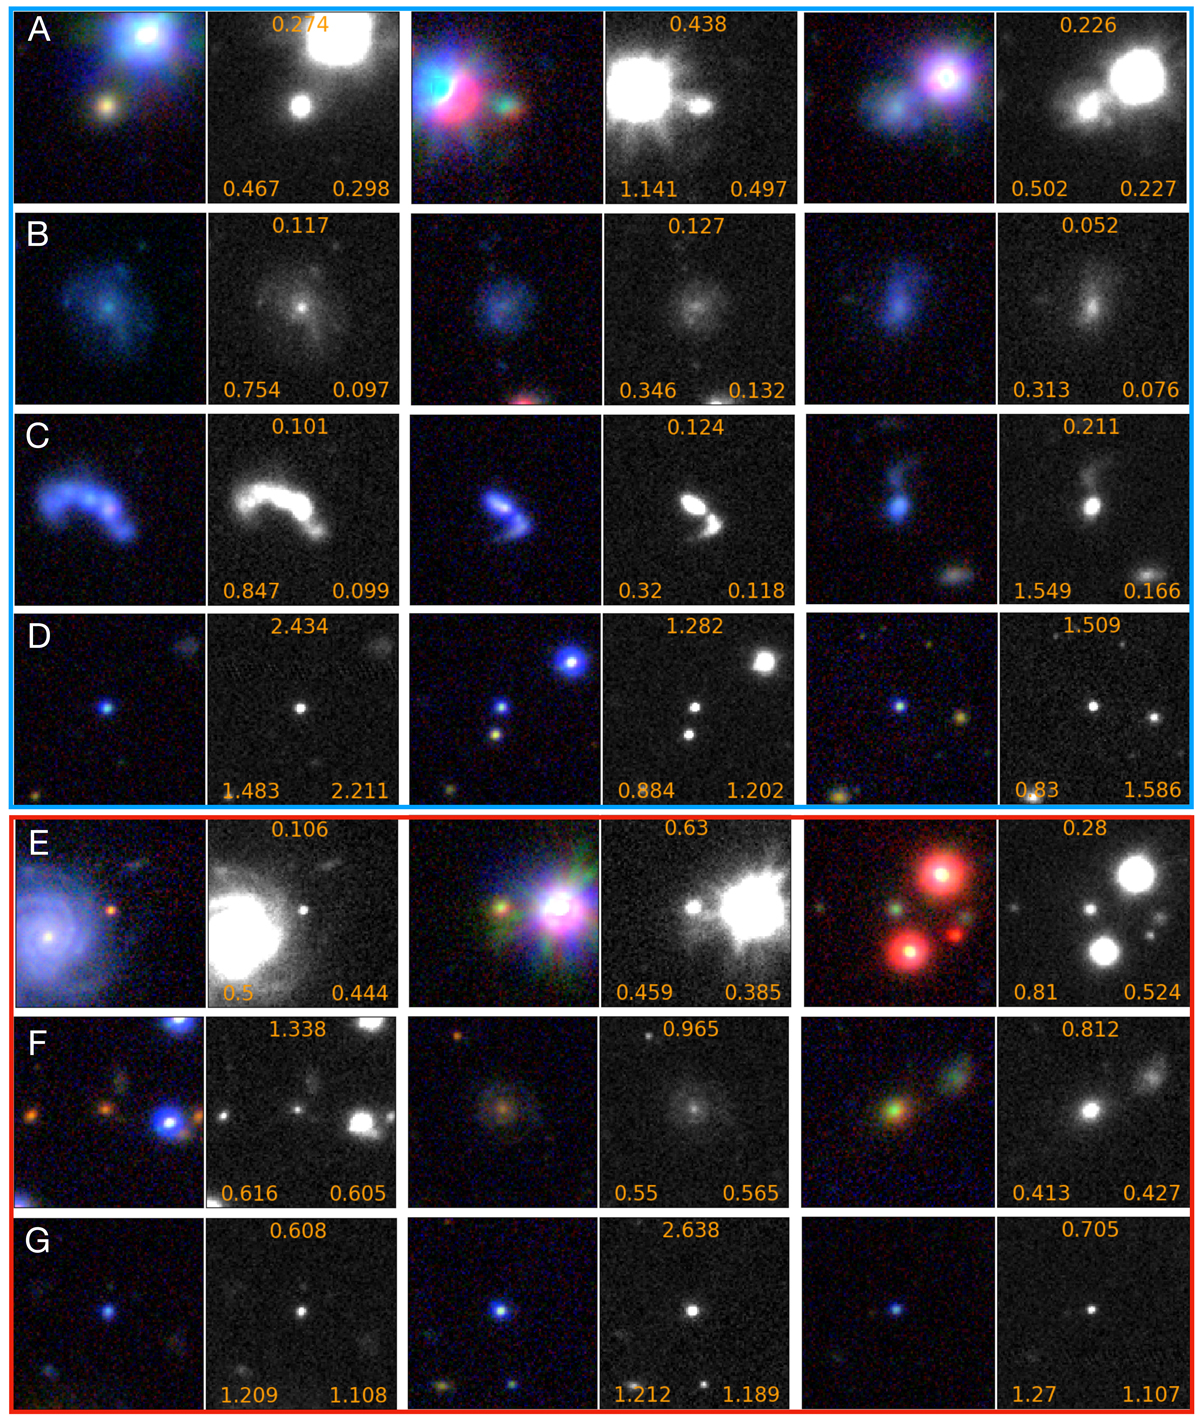
g, r, i color-composited color images (20″ × 20″) and the corresponding r-band images for some representative outliers. Rows A, B, C, and D (blue framed) show the outliers in GaZNet–C9, which are no longer outliers in GaZNet-1 predictions. Rows E, F, and G (red framed) show the objects that remain outliers both for GaZNet-1 and GaZNet-C9. In the r-band images, we report spec-z at the top, the GaZNet-C9 photo-z in the bottom left, and the GaZNet-1 morphoto-z in the bottom right.
Current usage metrics show cumulative count of Article Views (full-text article views including HTML views, PDF and ePub downloads, according to the available data) and Abstracts Views on Vision4Press platform.
Data correspond to usage on the plateform after 2015. The current usage metrics is available 48-96 hours after online publication and is updated daily on week days.
Initial download of the metrics may take a while.