Open Access
Fig. 4.
Download original image
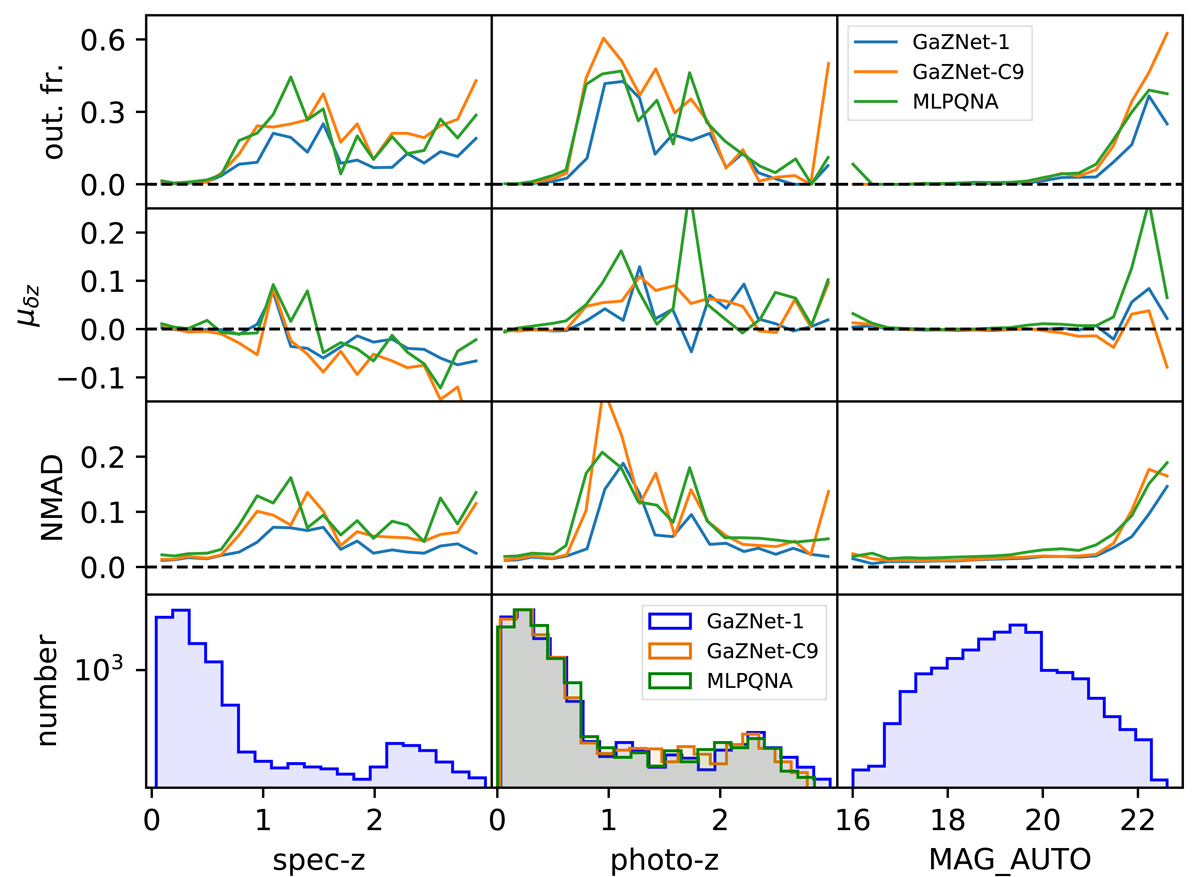
Outlier fraction (out. fr.), mean bias (μδz), and scatter (NMAD) as functions of spec-z, photo-z, and magnitude in 20 bins. In each panel, the blue line is for GaZNet-1, orange is for GaZNet-C9, and green is for MLPQNA. In the last row, we also present the number distribution in the corresponding parameter space.
Current usage metrics show cumulative count of Article Views (full-text article views including HTML views, PDF and ePub downloads, according to the available data) and Abstracts Views on Vision4Press platform.
Data correspond to usage on the plateform after 2015. The current usage metrics is available 48-96 hours after online publication and is updated daily on week days.
Initial download of the metrics may take a while.