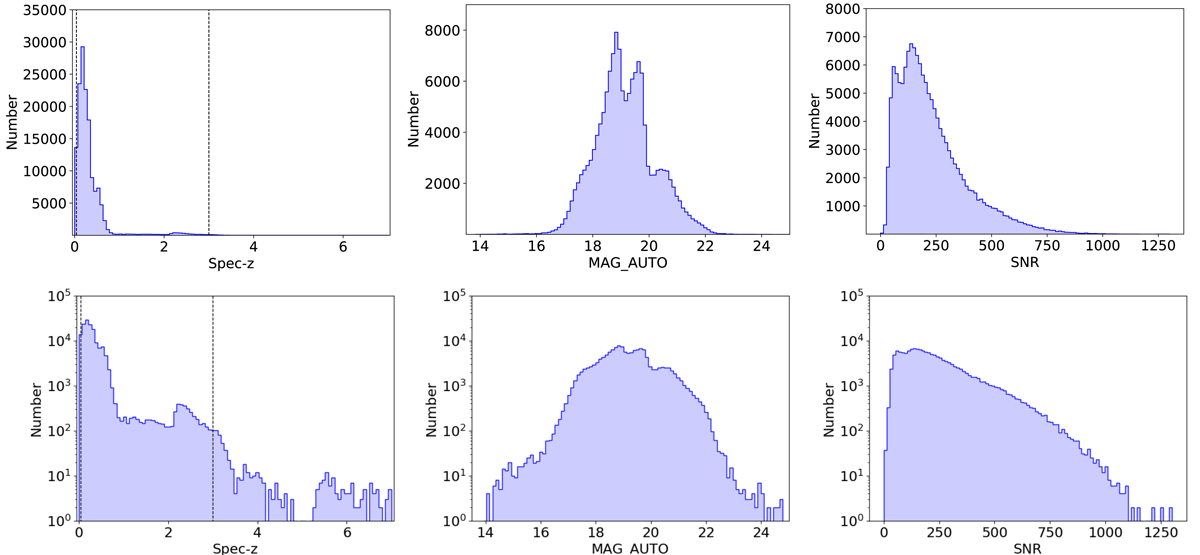
Fig. 2.
Download original image
Distribution of some relevant parameters of the training and testing data. In the top row, number counts are in linear scale, while in the bottom row number counts are in logarithmic scale. The first panel on the left shows the original spectroscopic sample of the 148 521 galaxies collected in KiDS+VIKING. However, only the 134 148 galaxies located between the two vertical dashed lines (spec-z = 0.04 and spec-z = 3) are used in this work for training and testing the GaZNets. For these galaxies, we show the MAG_AUTO and S/Ns in the second and third panels.
Current usage metrics show cumulative count of Article Views (full-text article views including HTML views, PDF and ePub downloads, according to the available data) and Abstracts Views on Vision4Press platform.
Data correspond to usage on the plateform after 2015. The current usage metrics is available 48-96 hours after online publication and is updated daily on week days.
Initial download of the metrics may take a while.