Fig. 8
Download original image
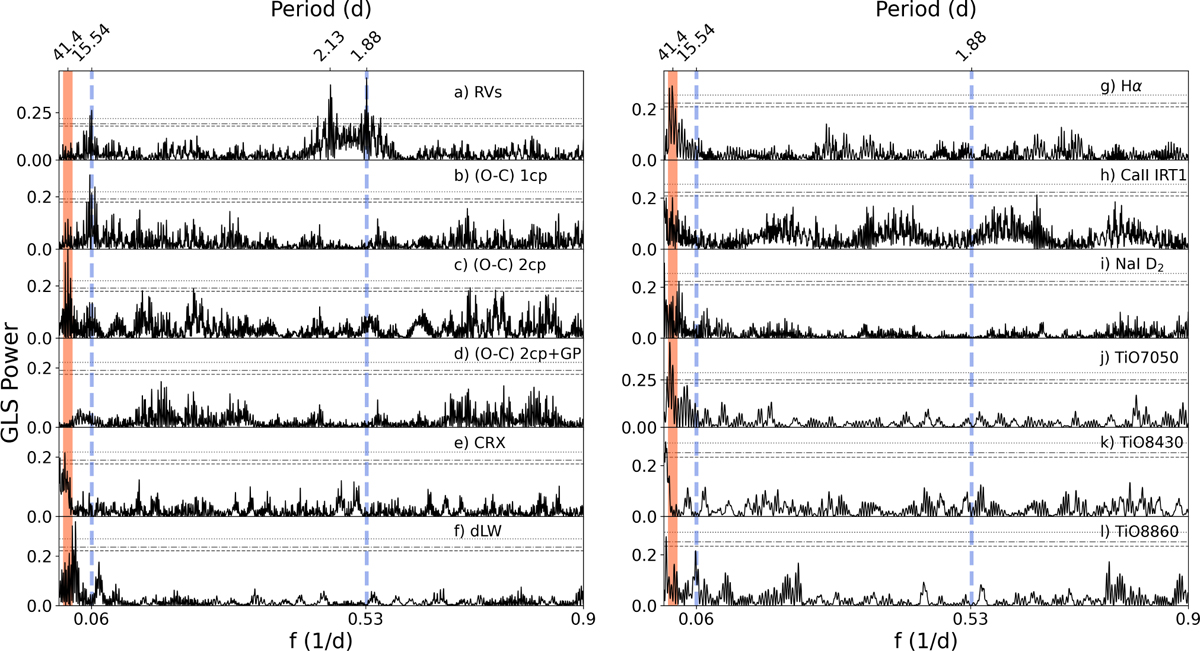
GLS periodograms of: (a) RV measurements from CARMENES VIS and MAROON-X data; (b) RV residuals after subtracting the inner planet signal at 1.88 d; (c) RV residuals after subtracting the two planet signals at 1.88 and 15.53 d; (d) RV residuals after subtracting the two planet signals plus a GP at ~41 d; (e-g) CRX, dLW, Hα, Ca II IRT1, and Na I D2 activity indices from the combined CARMENES VIS and MAROON-X data; (j-l) TiO7050, TiO8430, and TiO8860 activity indices from CARMENES VIS only. The “cp” in the residual models (panels a-d) corresponds to planets with circular orbits (see Sect. A.2 for a detailed explanation). In all panels, the vertical dashed blue lines correspond to the periods of the inner and outer planets at 1.88 d and 15.53 d, respectively. The orange shaded region corresponds to the stellar rotational period seen between 41 d and 44 d. The horizontal gray lines mark the theoretical FAP levels of 1% (dotted), 5% (dash-dotted), and 10% (dashed).
Current usage metrics show cumulative count of Article Views (full-text article views including HTML views, PDF and ePub downloads, according to the available data) and Abstracts Views on Vision4Press platform.
Data correspond to usage on the plateform after 2015. The current usage metrics is available 48-96 hours after online publication and is updated daily on week days.
Initial download of the metrics may take a while.