Fig. 5
Download original image
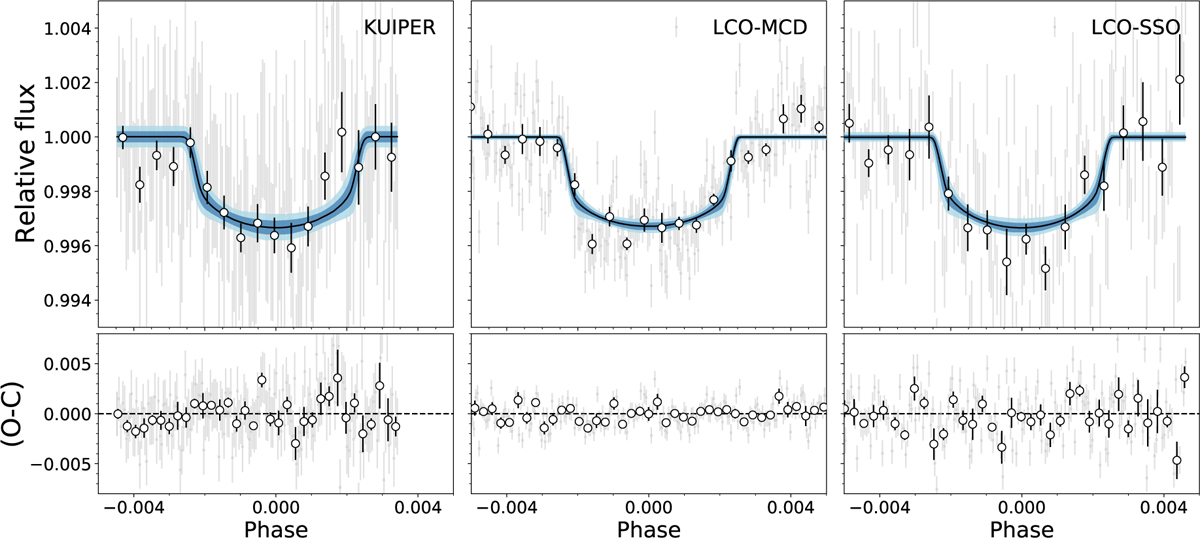
Ground-based photometry data for TOI-1468 c observed from various facilities, namely, SO-Kuiper, LCO-McD, and LCO-SSO. The normalized flux data are plotted in gray, with the binned data in circles, along with their error bars. The number of data points per bin was 10. The juliet best-fit model for each set is plotted as a solid black line, along with shaded regions: light blue for the 95% confidence interval, and dark blue for the 68% confidence interval. The residuals are plotted in the bottom part of each of the panels.
Current usage metrics show cumulative count of Article Views (full-text article views including HTML views, PDF and ePub downloads, according to the available data) and Abstracts Views on Vision4Press platform.
Data correspond to usage on the plateform after 2015. The current usage metrics is available 48-96 hours after online publication and is updated daily on week days.
Initial download of the metrics may take a while.