Open Access
Fig. 14
Download original image
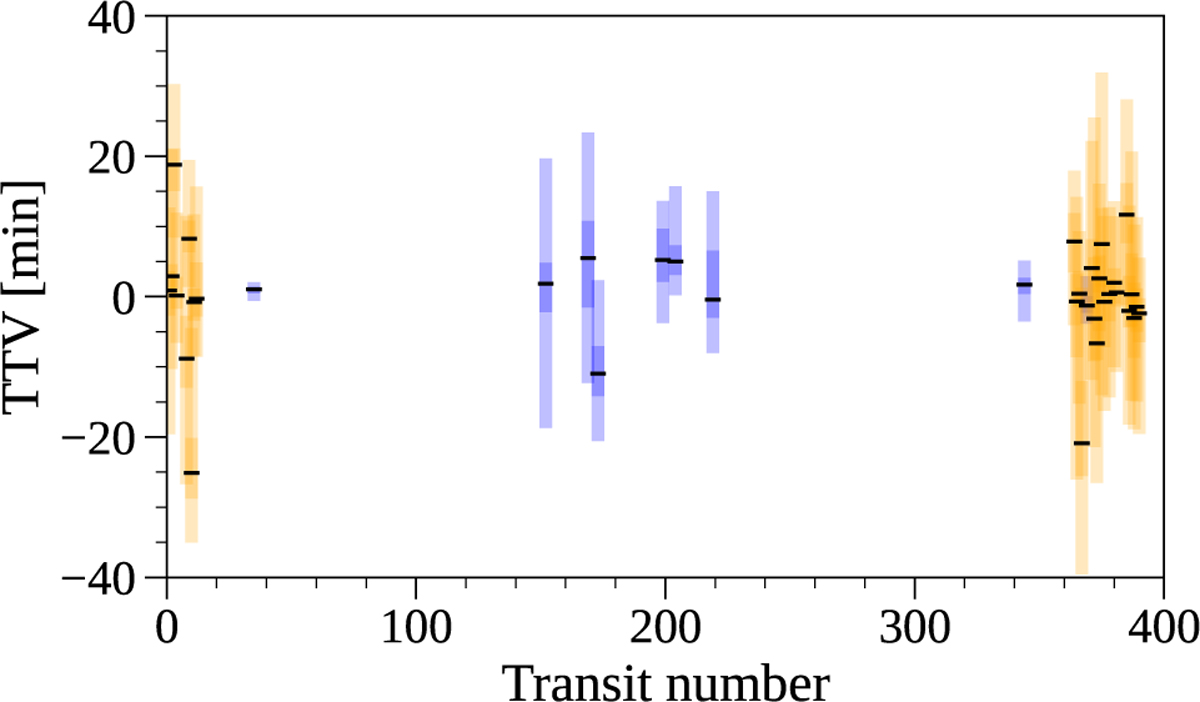
TOI-1468b transit-timing variations from TESS data (orange) and follow-up observations (blue). The different shades of color of the error bars represent the 1σ (dark) and 3σ (light) levels of uncertainty of the measurements. No significant TTVs are detected in the ~750 d of baseline covered by the observations.
Current usage metrics show cumulative count of Article Views (full-text article views including HTML views, PDF and ePub downloads, according to the available data) and Abstracts Views on Vision4Press platform.
Data correspond to usage on the plateform after 2015. The current usage metrics is available 48-96 hours after online publication and is updated daily on week days.
Initial download of the metrics may take a while.