Open Access
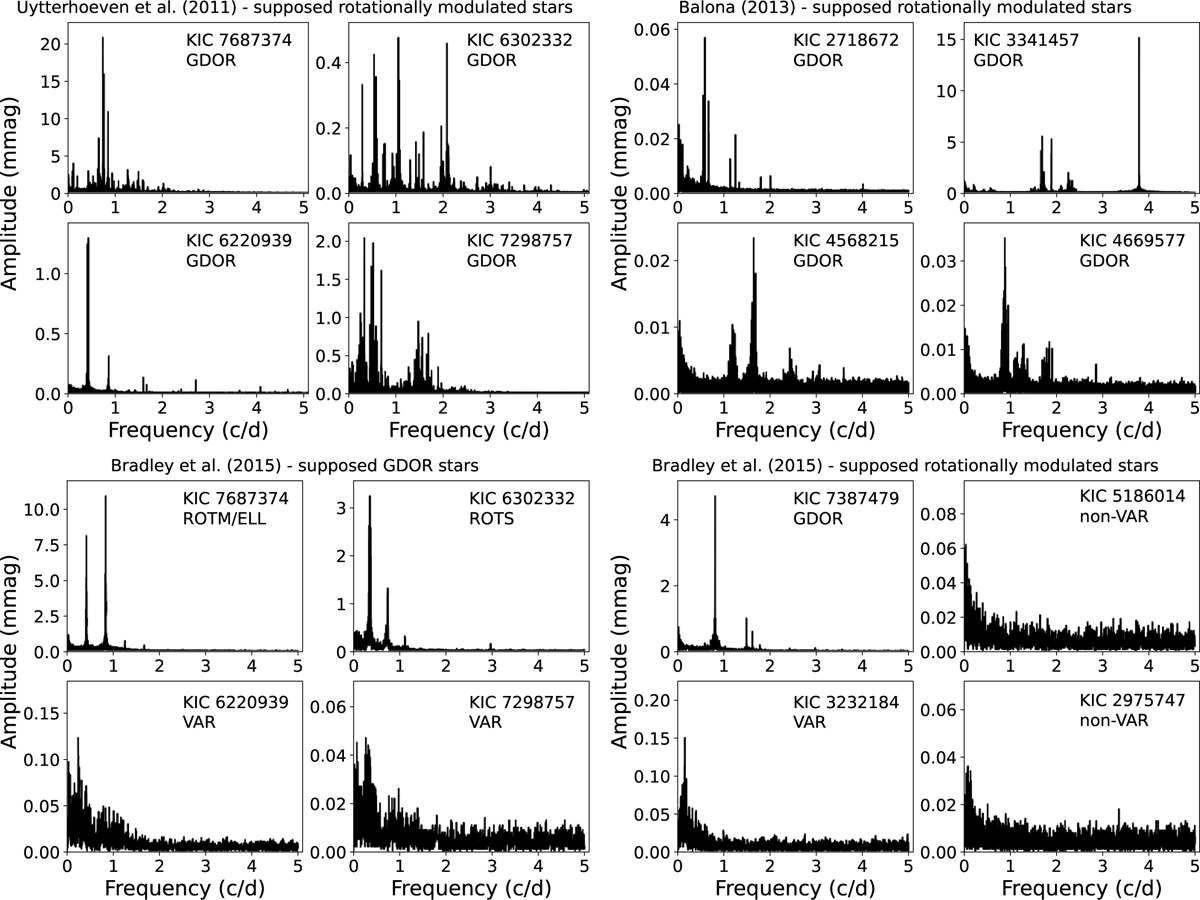
Fig. 13
Download original image
Frequency spectra of stars observed by the Kepler mission and classified in previous studies (shown on the top of every four plots). The labels give how the stars would be classified using our methodology.
Current usage metrics show cumulative count of Article Views (full-text article views including HTML views, PDF and ePub downloads, according to the available data) and Abstracts Views on Vision4Press platform.
Data correspond to usage on the plateform after 2015. The current usage metrics is available 48-96 hours after online publication and is updated daily on week days.
Initial download of the metrics may take a while.