Fig. 5.
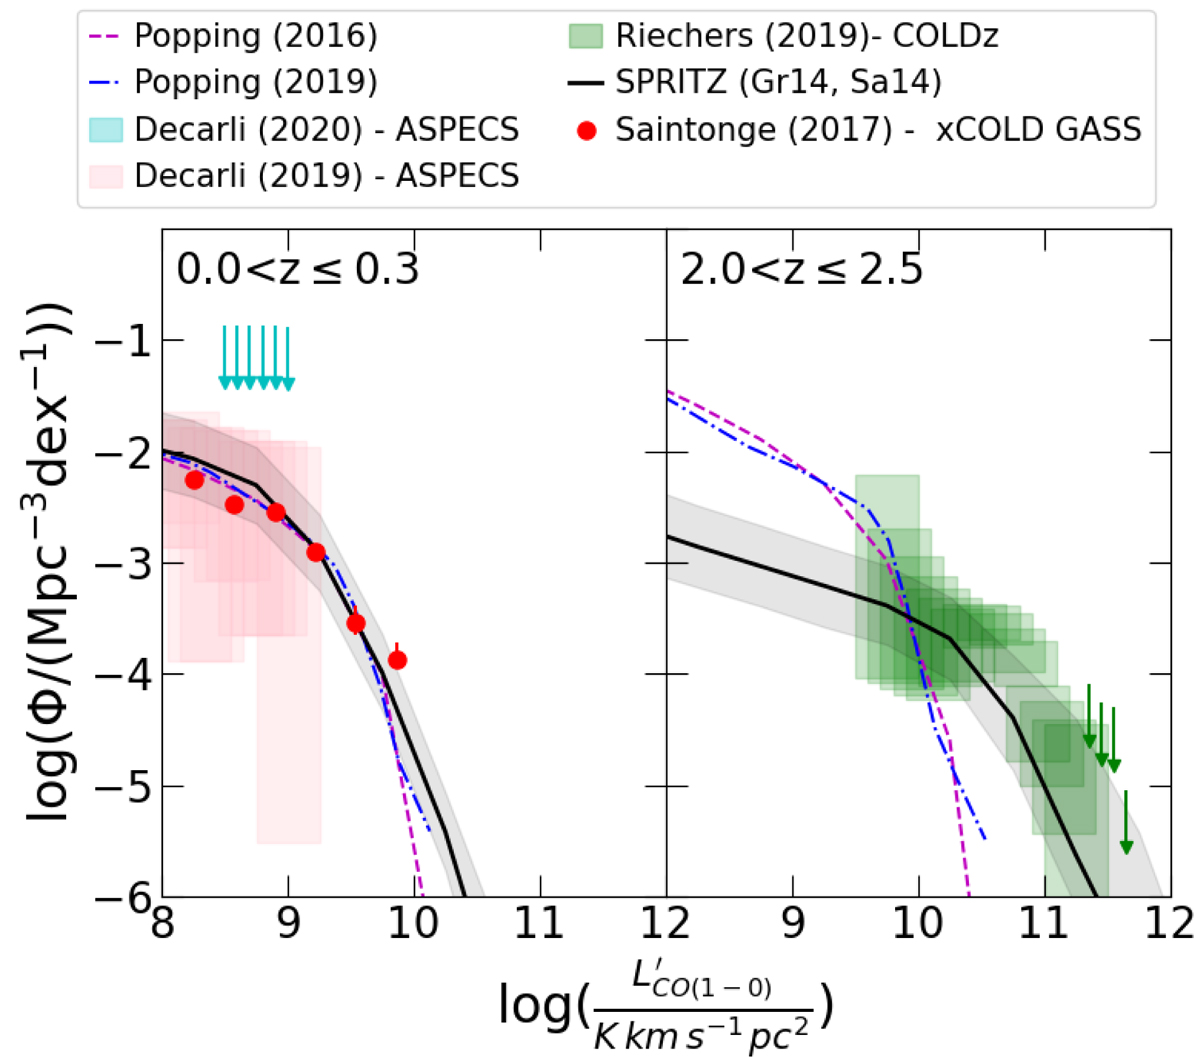
Download original image
CO(1−0) LF (solid black lines) derived with SPRITZ, compared with observations by Saintonge et al. (2017, red circles), Riechers et al. (2019, green squares), Decarli et al. (2019, pink squares), and Decarli et al. (2020, cyan arrows as upper limits). The grey shaded area contains the propagated errors of the IR LF and errors in the relations used to derive the CO(1−0) luminosity. We also report the models by Popping et al. (2016, dashed magenta lines) and Popping et al. (2019b, dash-dotted blue line). Gr14 and Sa14 refer to the relations by Greve et al. (2014) and Sargent et al. (2014), respectively.
Current usage metrics show cumulative count of Article Views (full-text article views including HTML views, PDF and ePub downloads, according to the available data) and Abstracts Views on Vision4Press platform.
Data correspond to usage on the plateform after 2015. The current usage metrics is available 48-96 hours after online publication and is updated daily on week days.
Initial download of the metrics may take a while.