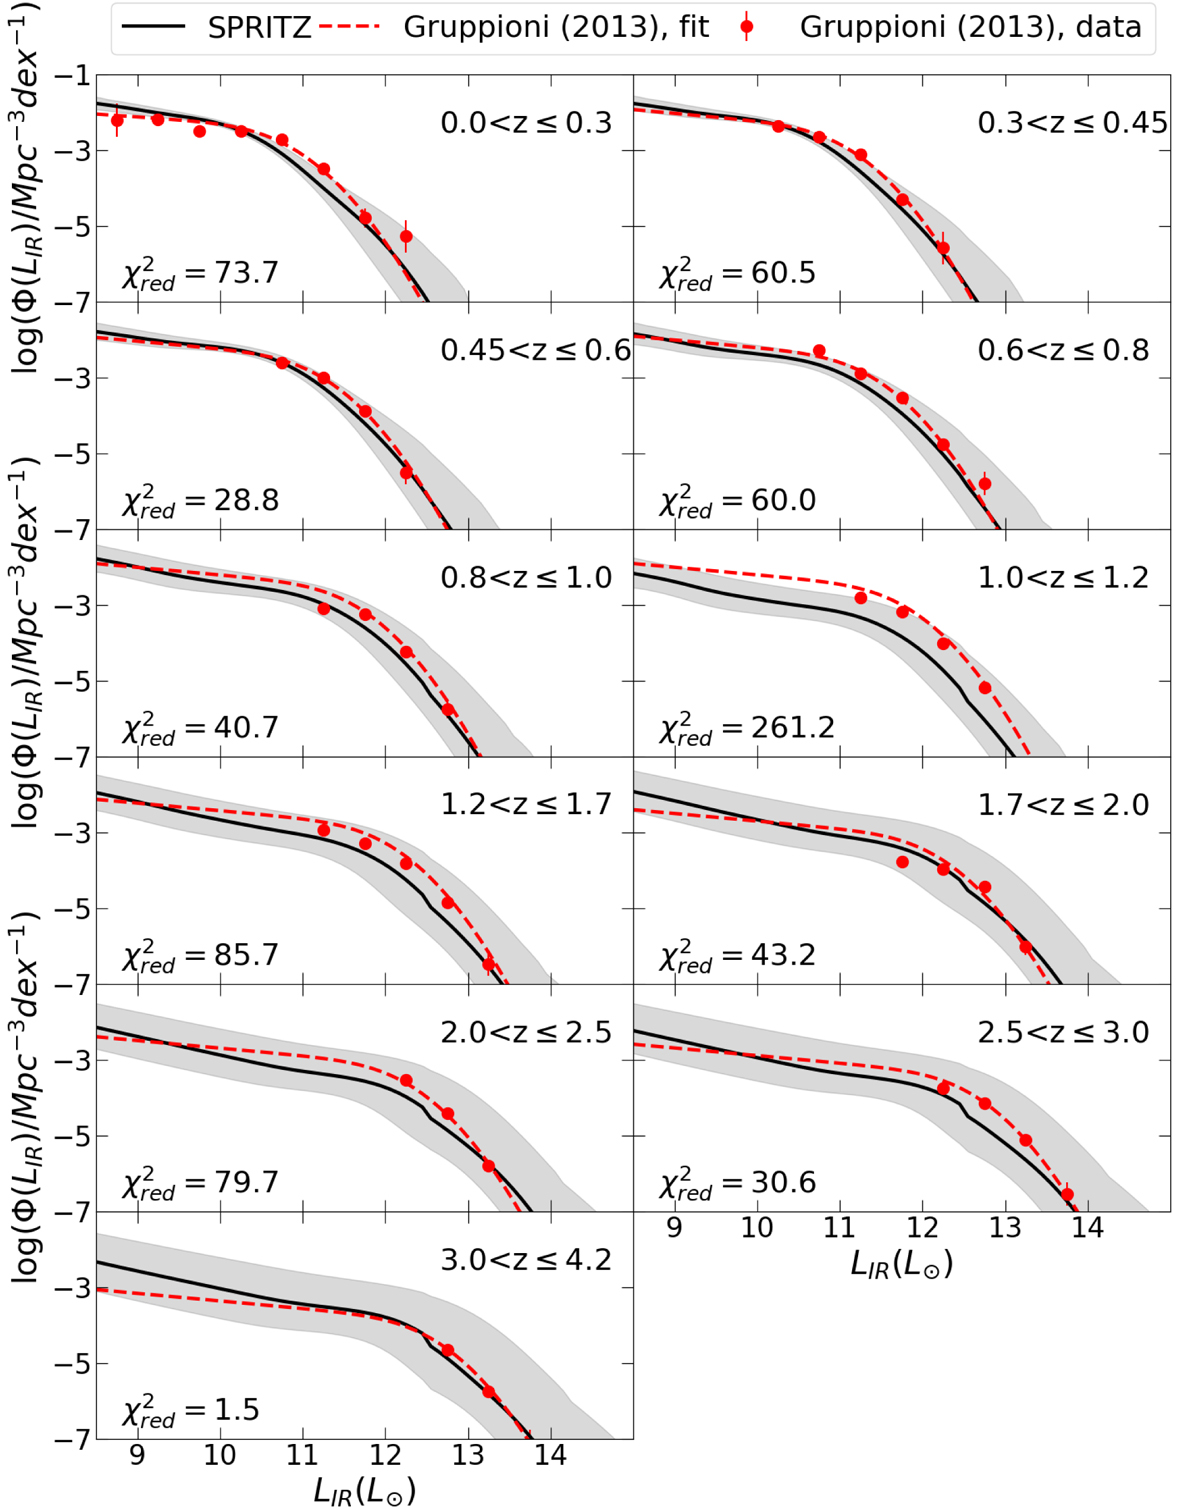
Fig. E.1.
Download original image
Comparison between the total IR LF in SPRITZ (solid black lines) and the total IR LF observed by Herschel (red circles). We also report the best fits (dashed red lines) for each redshift bin, as derived by Gruppioni et al. (2013). Grey shaded areas indicate the 1σ uncertainties associated with the SPRITZ IR LF. In each panel we also report the reduced χ2 associated with each redshift bin.
Current usage metrics show cumulative count of Article Views (full-text article views including HTML views, PDF and ePub downloads, according to the available data) and Abstracts Views on Vision4Press platform.
Data correspond to usage on the plateform after 2015. The current usage metrics is available 48-96 hours after online publication and is updated daily on week days.
Initial download of the metrics may take a while.