Open Access
Fig. 7
Download original image
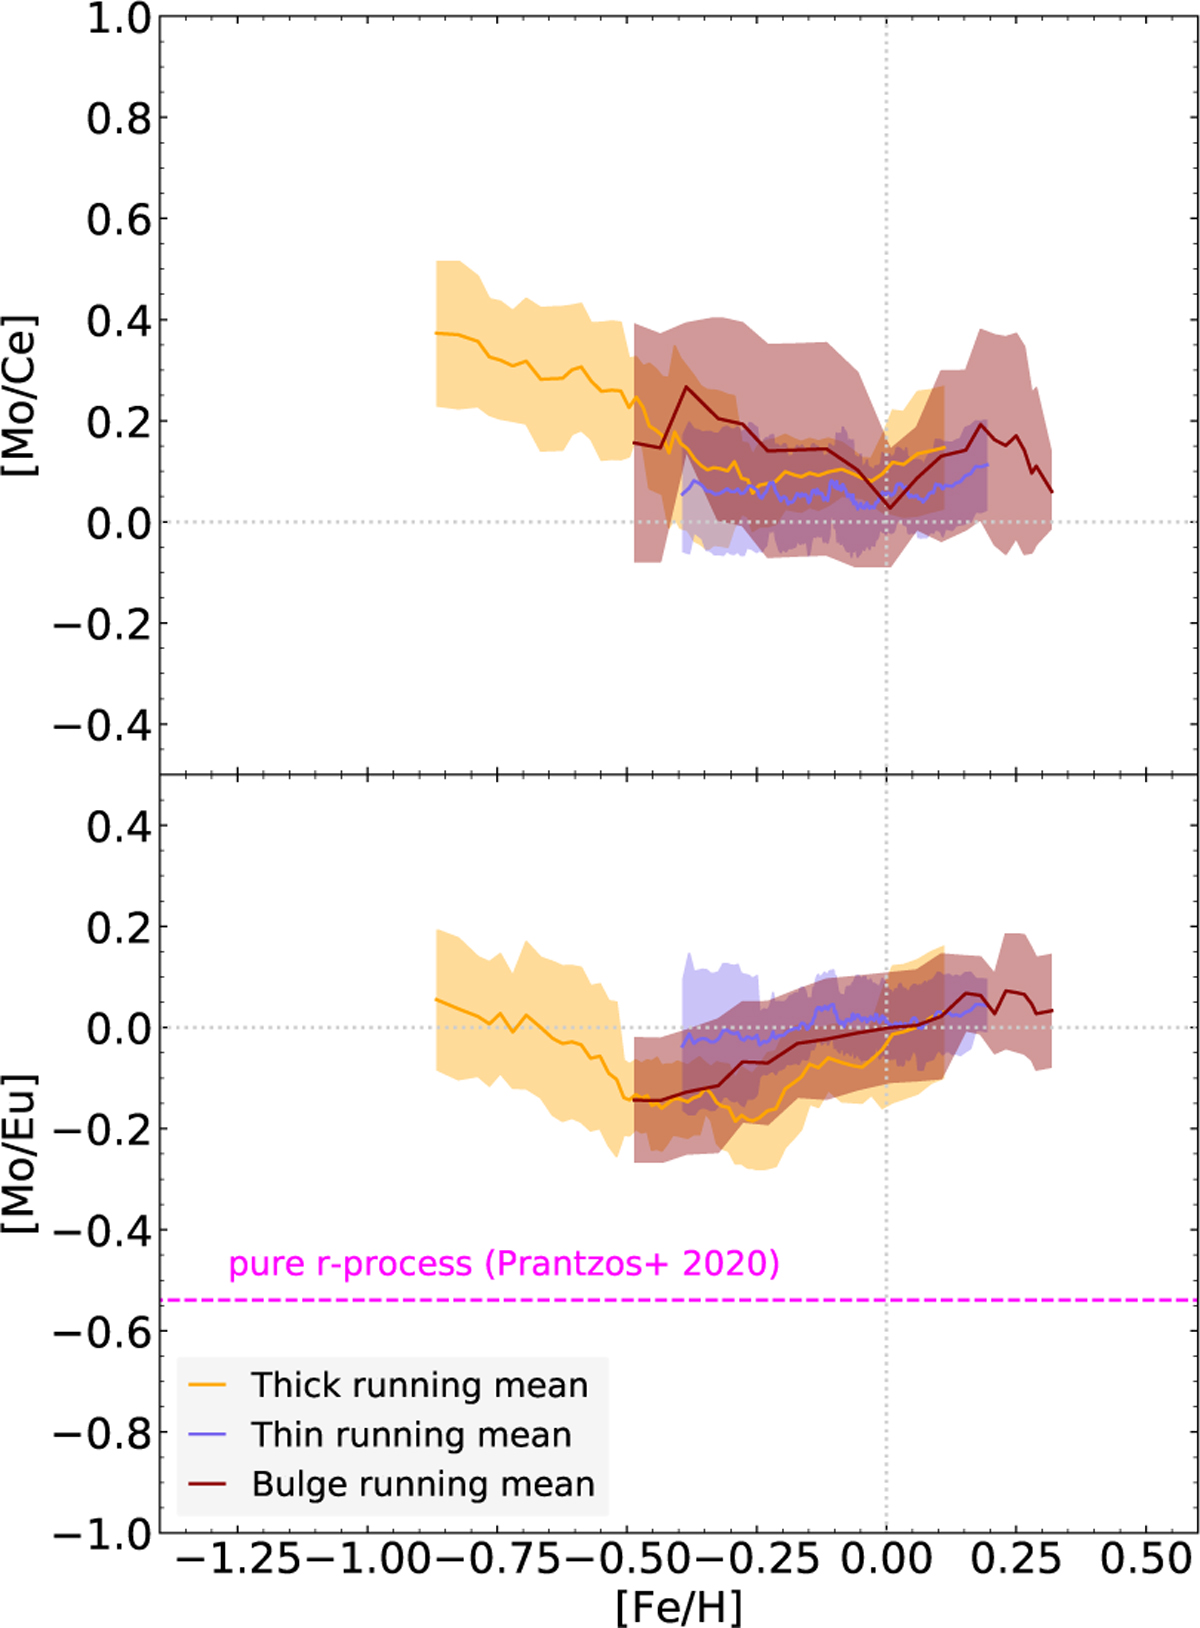
Comparison of Mo with the s-process element Ce (top) and the r-process element Eu (bottom), for the running means of the populations, similarly to Fig. 6. We also plot the pure r-process line using the values in Prantzos et al. (2020; magenta).
Current usage metrics show cumulative count of Article Views (full-text article views including HTML views, PDF and ePub downloads, according to the available data) and Abstracts Views on Vision4Press platform.
Data correspond to usage on the plateform after 2015. The current usage metrics is available 48-96 hours after online publication and is updated daily on week days.
Initial download of the metrics may take a while.