Fig. 6
Download original image
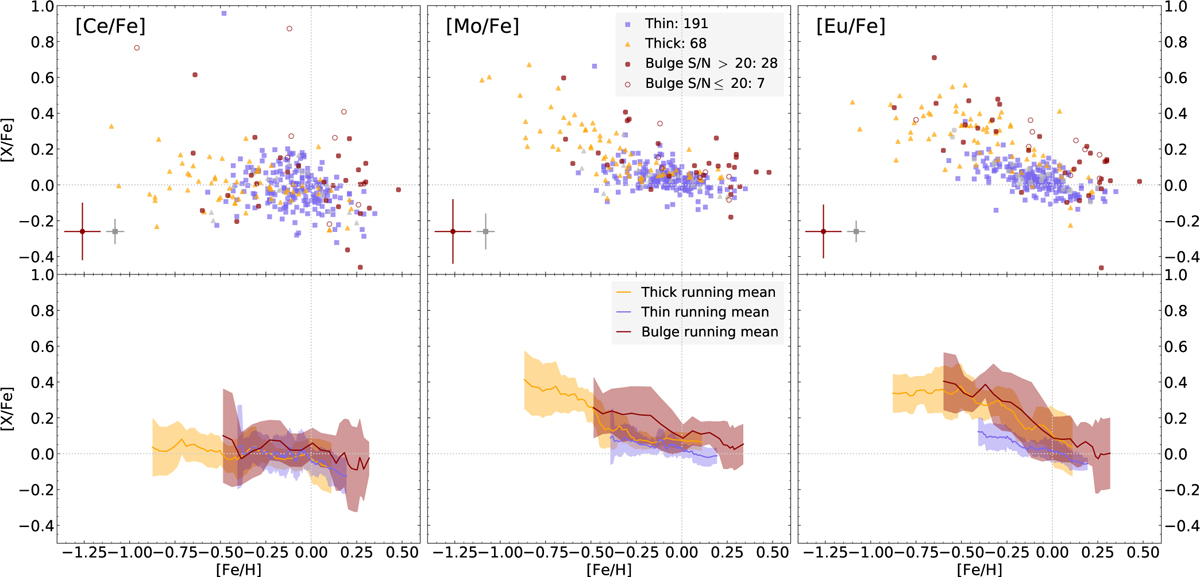
[Mo/Fe] over [Fe/H] for the thick disk (yellow), thin disk (blue), and bulge (red) stars seen in the middle panels. The number of stars in each population is marked in the legend of the scatter plot (upper). The running mean (lower) is calculated using a box size of 10 (thick), 20 (thin), and 7 (bulge) stars and plotted with a 1σ deviation. We note that for the bulge, we only use stars with a spectra of >20 S/N to produce the running mean. We compare this to the s-process element Ce (left) and r-process element Eu (right) from Forsberg et al. (2019). The typical uncertainties are indicated in the lower right corner of the plots (red for bulge, grey for disk). The grey dashed lines that go through [0, 0] indicate the solar value, which we have normalised to A(Fe) = 7.45, A(Ce) = 1.70 (Grevesse et al. 2007), A(Mo) = 1.88, A(Eu) = 0.52 (Grevesse et al. 2015). The [Eu/Fe] values in Forsberg et al. (2019) are reported to likely be systematically too high, possibly originating from the systematic uncertainties in log(g) as reported in Paper I. Due to this, we lower the [Eu/Fe] abundances by 0.10 dex in this figure, such that the thin disk in [Eu/Fe] goes through the solar value.
Current usage metrics show cumulative count of Article Views (full-text article views including HTML views, PDF and ePub downloads, according to the available data) and Abstracts Views on Vision4Press platform.
Data correspond to usage on the plateform after 2015. The current usage metrics is available 48-96 hours after online publication and is updated daily on week days.
Initial download of the metrics may take a while.