Fig. 5
Download original image
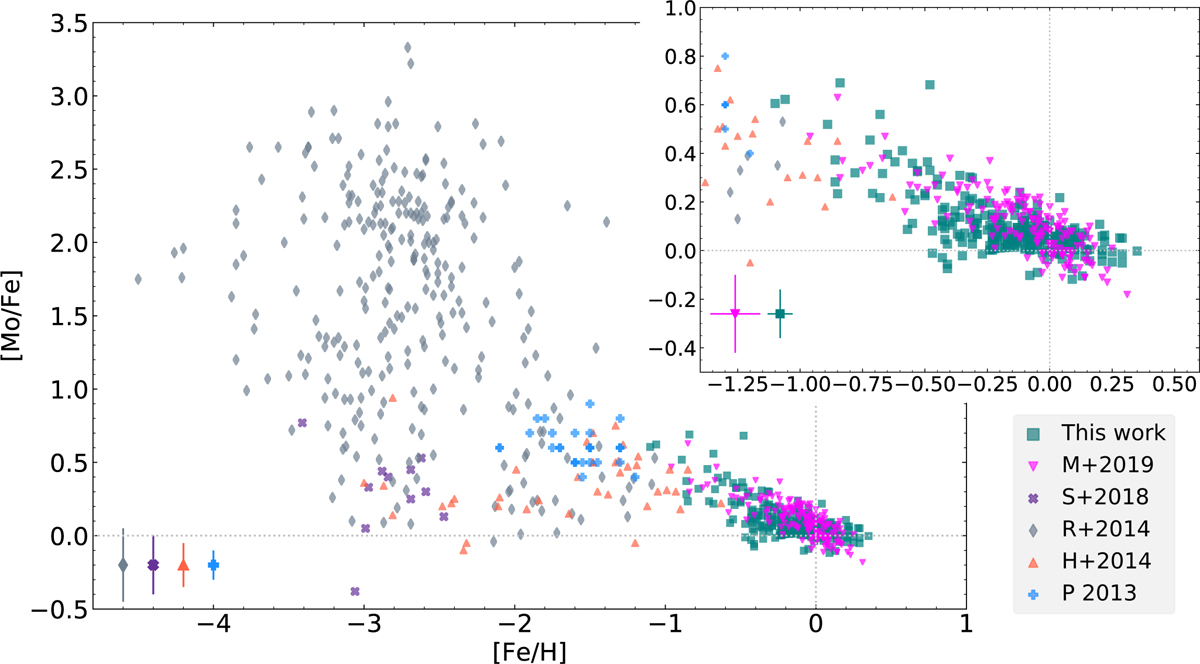
Comparing the [Mo/Fe] disk abundances determined in this work (teal squares, as in Fig. 3) to those in previous studies in the disk (Mishenina et al. 2019, magenta downward pointing triangles) and the halo (Peterson 2013; Roederer et al. 2014a; Hansen et al. 2014; Spite et al. 2018, blue pluses, grey diamonds, coral triangles, purple crosses, respectively). This is also indicated in the lower right legend. The smaller upper rightmost plot shows a zoomed in portion of the higher metallicity region in the larger leftmost plot. The typical uncertainties reported in the studies are indicated in the lower left corner of both plots. The grey dashed lines that go through [0, 0] indicate the solar value, which we have normalised to A(Fe) = 7.45 (Grevesse et al. 2007) and A(Mo) =1.88 (Grevesse et al. 2015).
Current usage metrics show cumulative count of Article Views (full-text article views including HTML views, PDF and ePub downloads, according to the available data) and Abstracts Views on Vision4Press platform.
Data correspond to usage on the plateform after 2015. The current usage metrics is available 48-96 hours after online publication and is updated daily on week days.
Initial download of the metrics may take a while.