Fig. 4
Download original image
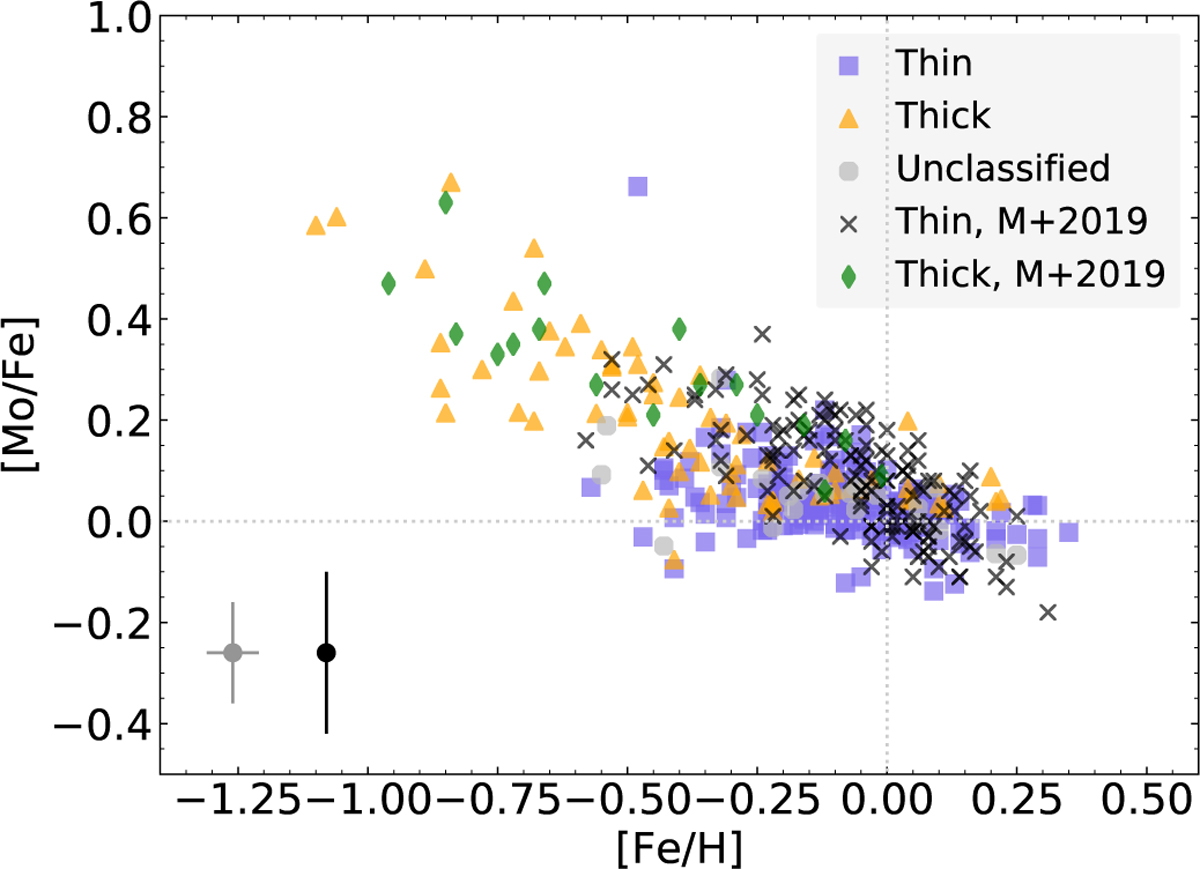
Comparison of the [Mo/Fe] thin (blue squares) and thick (orange triangles) disk abundances determined in this work with the thin (black crosses) and thick (green diamonds) disk in Mishenina et al. (2019). It should be noted that the 23 stars that we do not have kinematical data for have not been classified as either thin or thick disk, and can be seen as grey circles. The typical uncertainties are indicated in the lower left corner (this work in grey, Mishenina et al. 2019 in black). The grey dashed lines that go through [0, 0] indicate the solar value, which we have normalised to A(Fe) = 7.45 (Grevesse et al. 2007) and A(Mo) = 1.88 (Grevesse et al. 2015). The thin disk star at [Fe/H] = −0.55 with high molybdenum abundance of [Mo/Fe] = 0.68, HIP65028, is discussed at the end of Sect. 5.
Current usage metrics show cumulative count of Article Views (full-text article views including HTML views, PDF and ePub downloads, according to the available data) and Abstracts Views on Vision4Press platform.
Data correspond to usage on the plateform after 2015. The current usage metrics is available 48-96 hours after online publication and is updated daily on week days.
Initial download of the metrics may take a while.