Fig. 2
Download original image
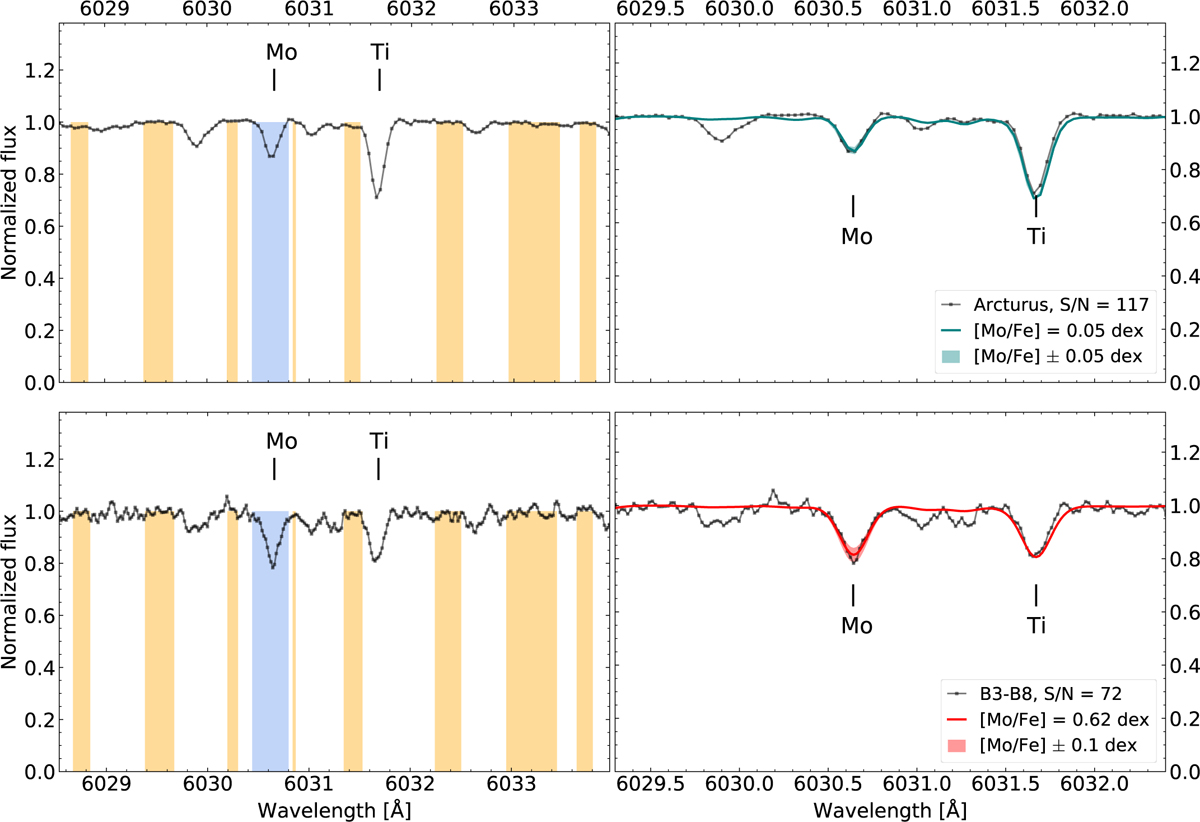
Observed spectrum (black) for a disk star (top, Arcturus) and bulge star (bottom, B3–B8). Left: line mask placements for the Mo line marked in blue and the continuum placements in yellow. Right: synthetic spectra, either in teal (top, disk star Arcturus) or red (bottom, bulge star B3–B8). The estimated S/N of both spectra, 117 and 72 respectively, are indicated in the legend. We note that the wavelength region of the rightmost figures is zoomed in with respect to the leftmost figures.
Current usage metrics show cumulative count of Article Views (full-text article views including HTML views, PDF and ePub downloads, according to the available data) and Abstracts Views on Vision4Press platform.
Data correspond to usage on the plateform after 2015. The current usage metrics is available 48-96 hours after online publication and is updated daily on week days.
Initial download of the metrics may take a while.