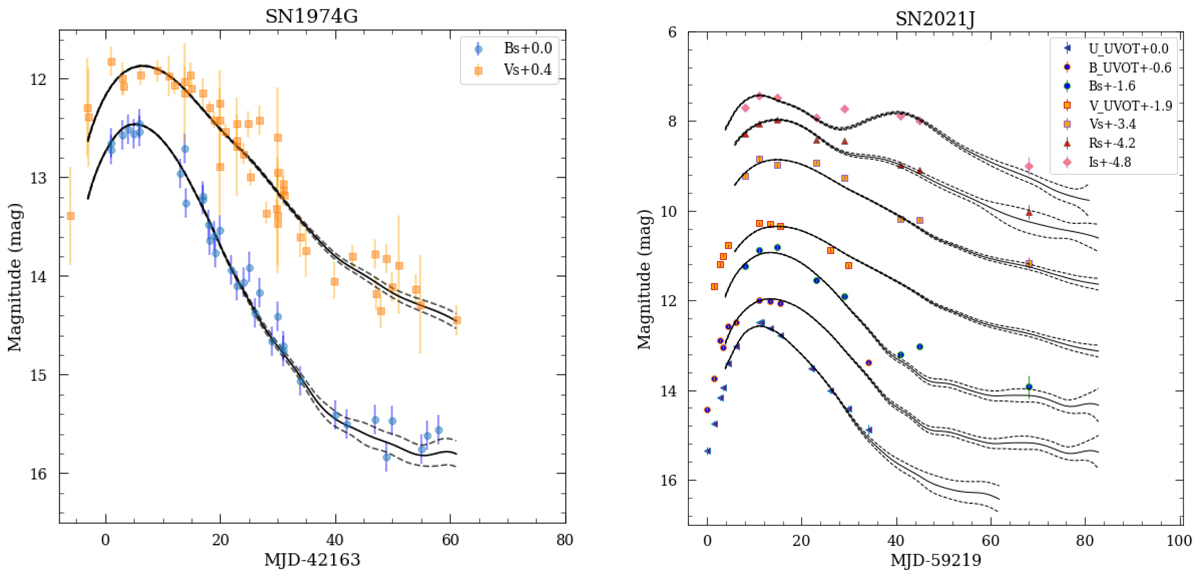
Fig. 3.
Download original image
LC fits of the siblings using SNooPy. Left: SN 1974G LCs fits. The orange and blue points correspond to the B- and V-band data taken from Schaefer (1998). The black lines indicate the SNooPy best-fits. Dashed lines are 1-σ errors. Right: SN 2021J LCs fits. The photometry data are obtained from the OSN and Swift. The legend indicates the color and shape of the symbols adopted for the different bands. The black lines indicate the SNooPy best-fits. Dashed lines are 1-σ errors.
Current usage metrics show cumulative count of Article Views (full-text article views including HTML views, PDF and ePub downloads, according to the available data) and Abstracts Views on Vision4Press platform.
Data correspond to usage on the plateform after 2015. The current usage metrics is available 48-96 hours after online publication and is updated daily on week days.
Initial download of the metrics may take a while.