Open Access
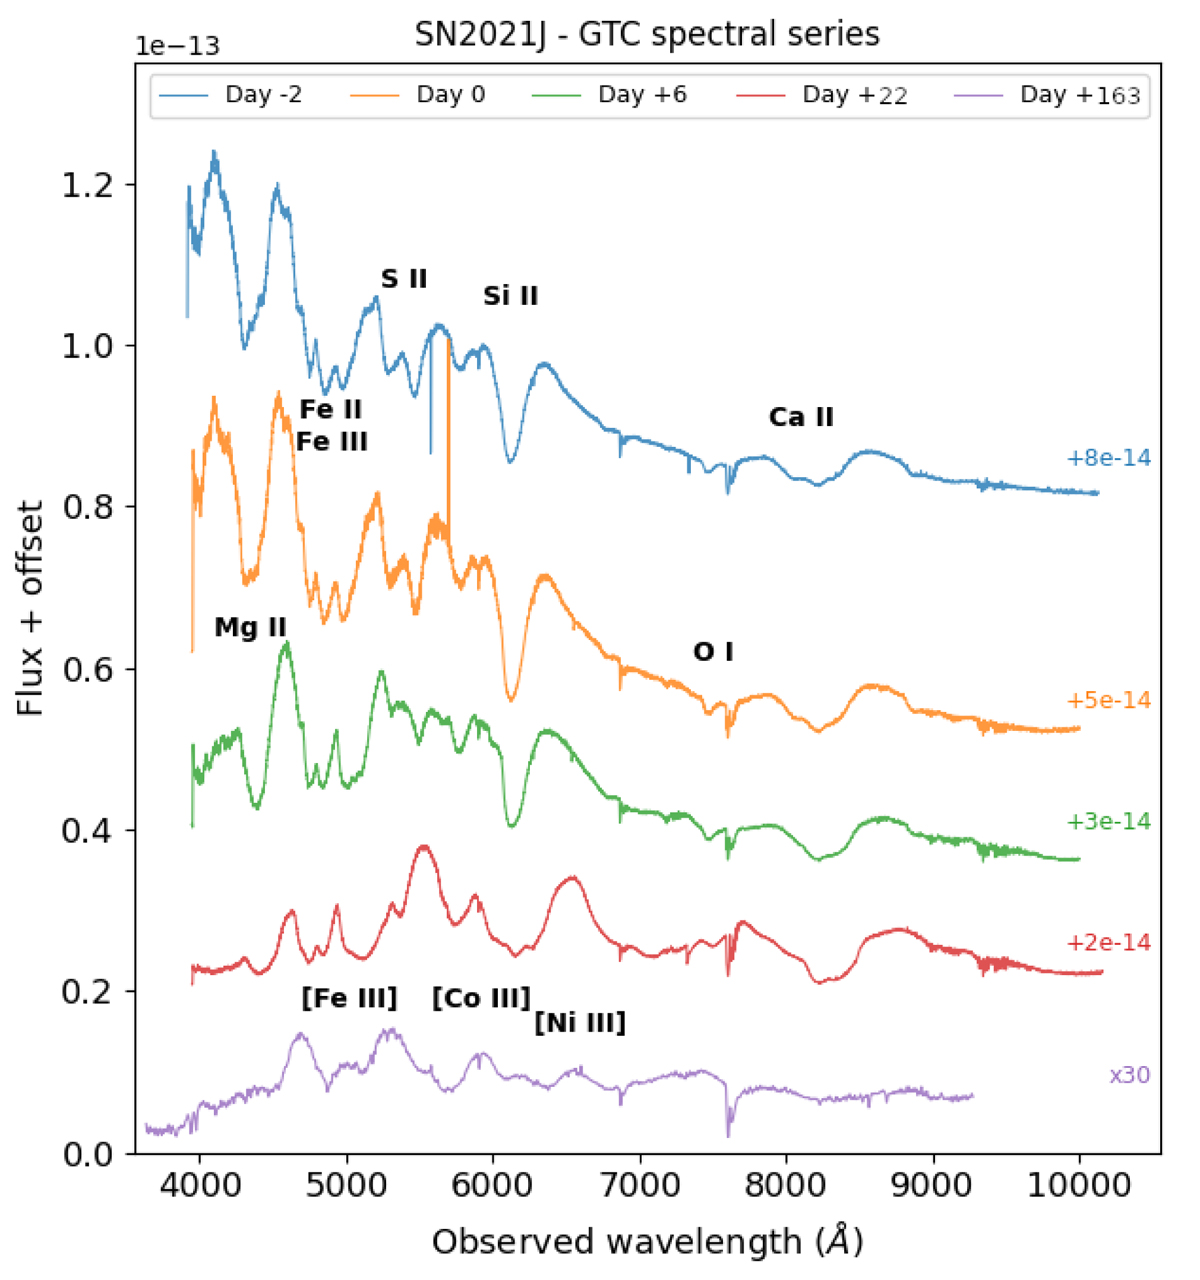
Fig. 2.
Download original image
Spectroscopic evolution of SN 2021J over the five epochs observed with OSIRIS/GTC. Each epoch (days from peak brightness) is plotted with a different color. Flux offset for each epoch are reported on the right end of each spectrum. The main line features are also reported, showing the type-Ia nature for SN 2021J.
Current usage metrics show cumulative count of Article Views (full-text article views including HTML views, PDF and ePub downloads, according to the available data) and Abstracts Views on Vision4Press platform.
Data correspond to usage on the plateform after 2015. The current usage metrics is available 48-96 hours after online publication and is updated daily on week days.
Initial download of the metrics may take a while.