Fig. 9
Download original image
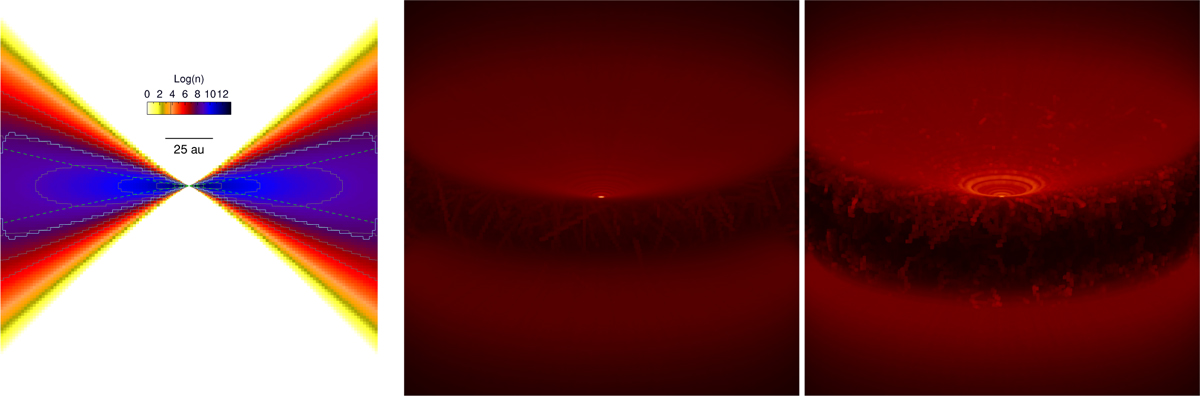
Disk model and infrared images. Left panel: adopted disk model density distribution. The dashed lines show the hydrostatic scale height as a function of distance to the star responsible for the disk flaring. The cyan line defines the boundary of the region where ice mantles are present due to the visual extinction threshold. Middle and right panels: RADMC-3D radiative transfer code Monte Carlo images for MRN (middle) and τ3 (right) size distributions, ray traced at a wavelength of 4 µm, for the silicates + M15 ice mixture disk model, at an inclination of 72°.
Current usage metrics show cumulative count of Article Views (full-text article views including HTML views, PDF and ePub downloads, according to the available data) and Abstracts Views on Vision4Press platform.
Data correspond to usage on the plateform after 2015. The current usage metrics is available 48-96 hours after online publication and is updated daily on week days.
Initial download of the metrics may take a while.