Fig. 8
Download original image
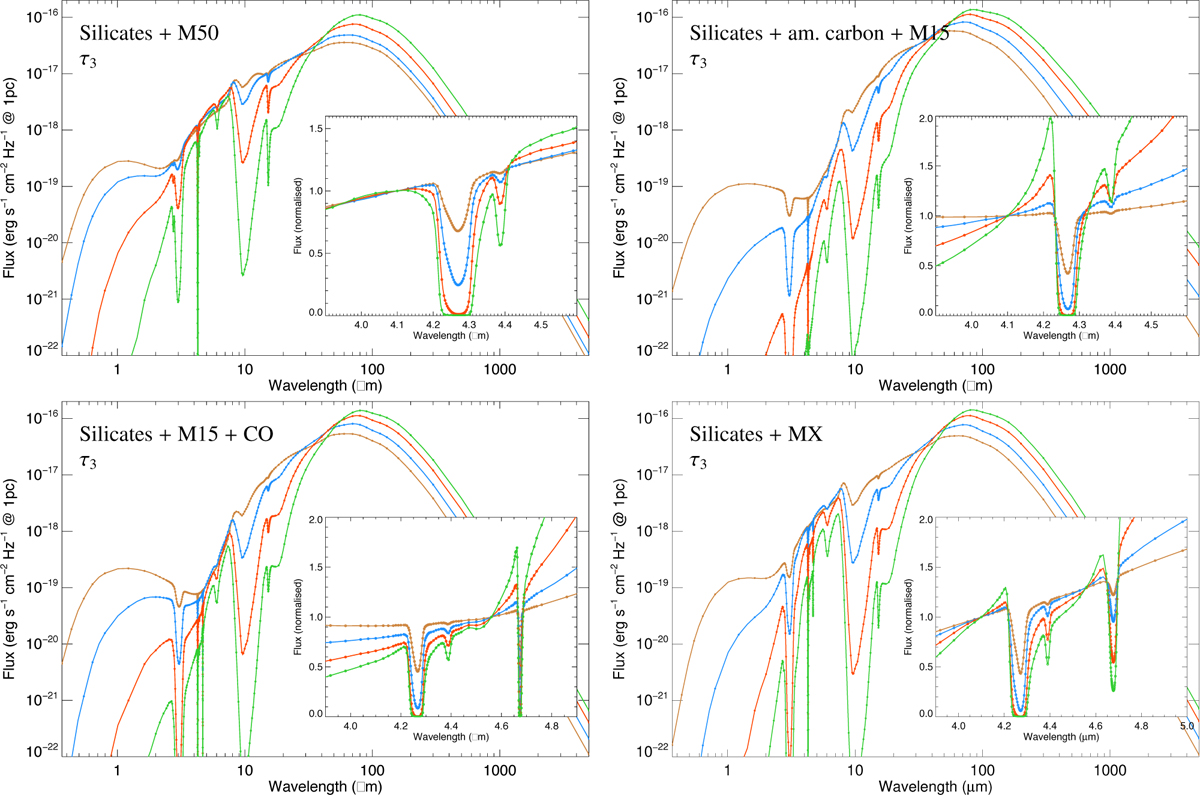
Same as Fig. 7 but including the other models considered for the ice and core composition. Shown from the top left to the lower right are: silicate core, M50 ice mantle composition and size distribution τ3, amax = 3µm (model #13); silicates and amorphous carbon core, M15 ice composition, and size distribution τ3, amax = 3 µm (model #16); silicate core, M15 ice mantle composition, including pure CO and size distribution τ3, amax = 3 µm (model #19); and silicate core, MX ice mantle composition, including H2O, CO2, CO, and NH3, and size distribution τ3, amax = 3 µm (model #22). The inserts display close-ups of the CO2 ice band (and CO for models #19,22), with spectra normalised at 4.1 µm (4.55 µm for models #19,22).
Current usage metrics show cumulative count of Article Views (full-text article views including HTML views, PDF and ePub downloads, according to the available data) and Abstracts Views on Vision4Press platform.
Data correspond to usage on the plateform after 2015. The current usage metrics is available 48-96 hours after online publication and is updated daily on week days.
Initial download of the metrics may take a while.