Fig. 6
Download original image
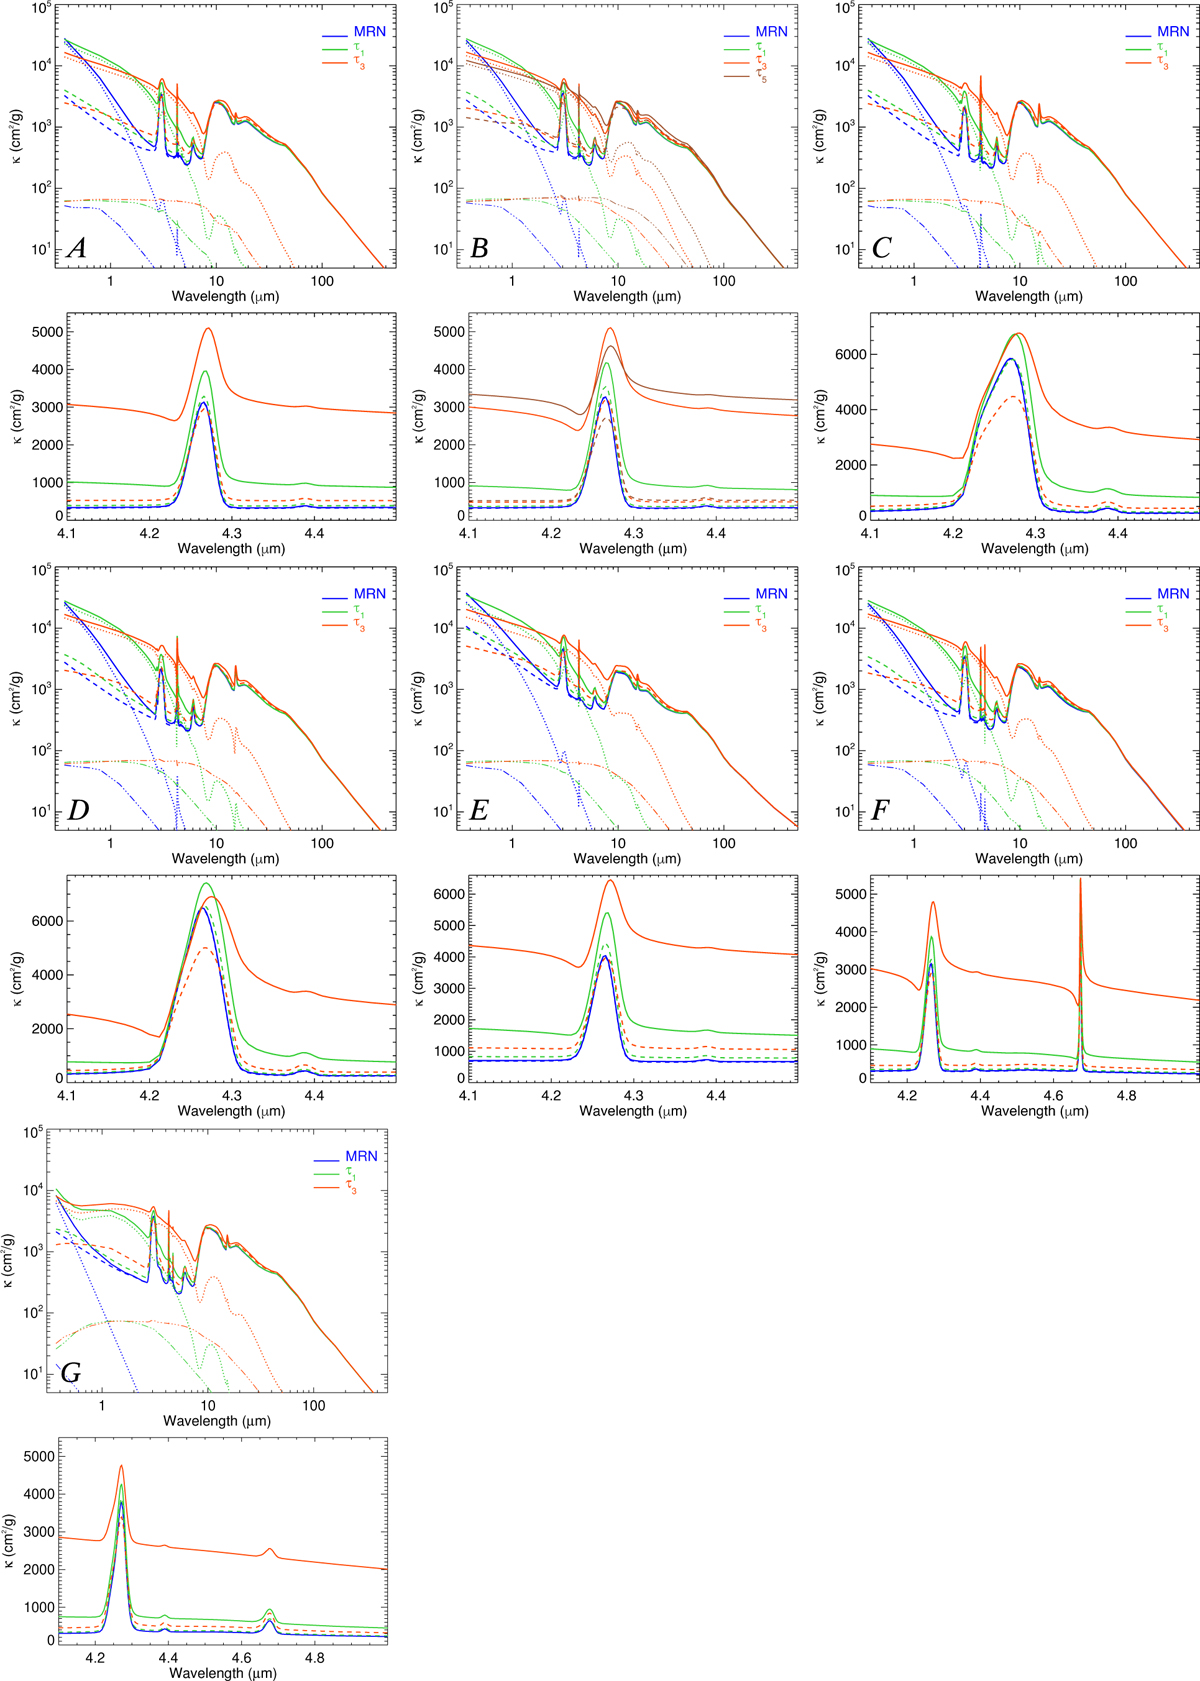
Mass extinction coefficients (solid lines), absorption coefficients (dashed line), and Henyey–Greenstein phase function g (dot-dashed line, ×100) for model sets A, B, C, D, E, F, and G (three models per panel corresponding to the MRN (amax = 0.25µm), τ1 (amax = 1 µm), and τ3 (amax = 3 µm) size distributions, respectively). Model set B includes a size distribution extending to τ5 (amax = 5 µm). Below each panel a close-up of the CO2 stretching mode is shown (which includes CO for the last two sets).
Current usage metrics show cumulative count of Article Views (full-text article views including HTML views, PDF and ePub downloads, according to the available data) and Abstracts Views on Vision4Press platform.
Data correspond to usage on the plateform after 2015. The current usage metrics is available 48-96 hours after online publication and is updated daily on week days.
Initial download of the metrics may take a while.