Fig. 4
Download original image
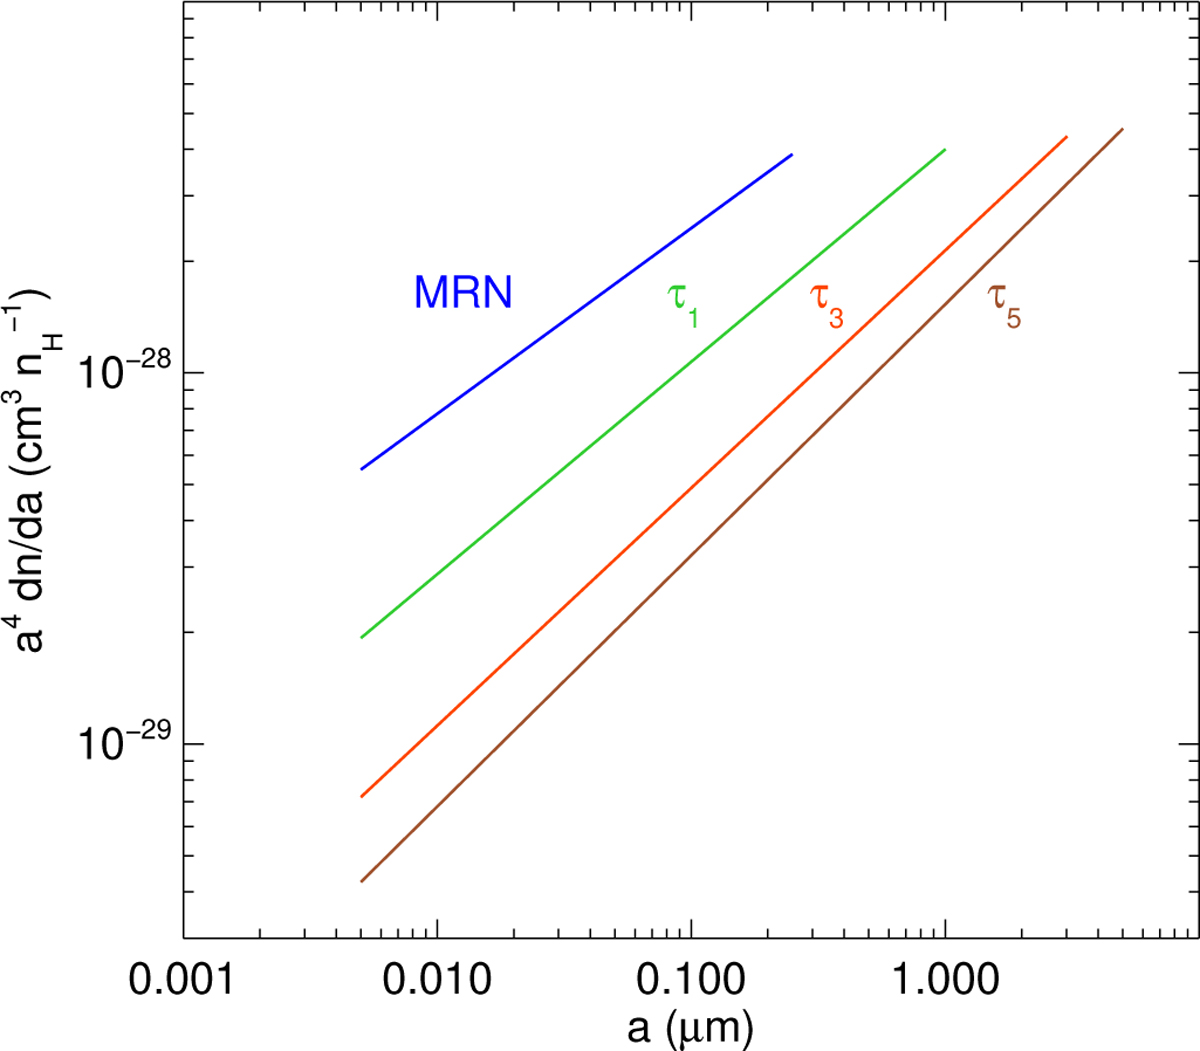
Size distributions that qualitatively reproduce the expected size evolution behaviour for dust grain growth in aggregation models. The lower bound of the grain sizes is kept constant at 0.005 The upper bound of the distribution is varied from 0.25 µm (MRN distribution) to 1 µm (τ1), 3 µm (τ3) and 5 µm (τ5), and the slope is defined to maintain the same total mass. See text for details.
Current usage metrics show cumulative count of Article Views (full-text article views including HTML views, PDF and ePub downloads, according to the available data) and Abstracts Views on Vision4Press platform.
Data correspond to usage on the plateform after 2015. The current usage metrics is available 48-96 hours after online publication and is updated daily on week days.
Initial download of the metrics may take a while.