Fig. 16
Download original image
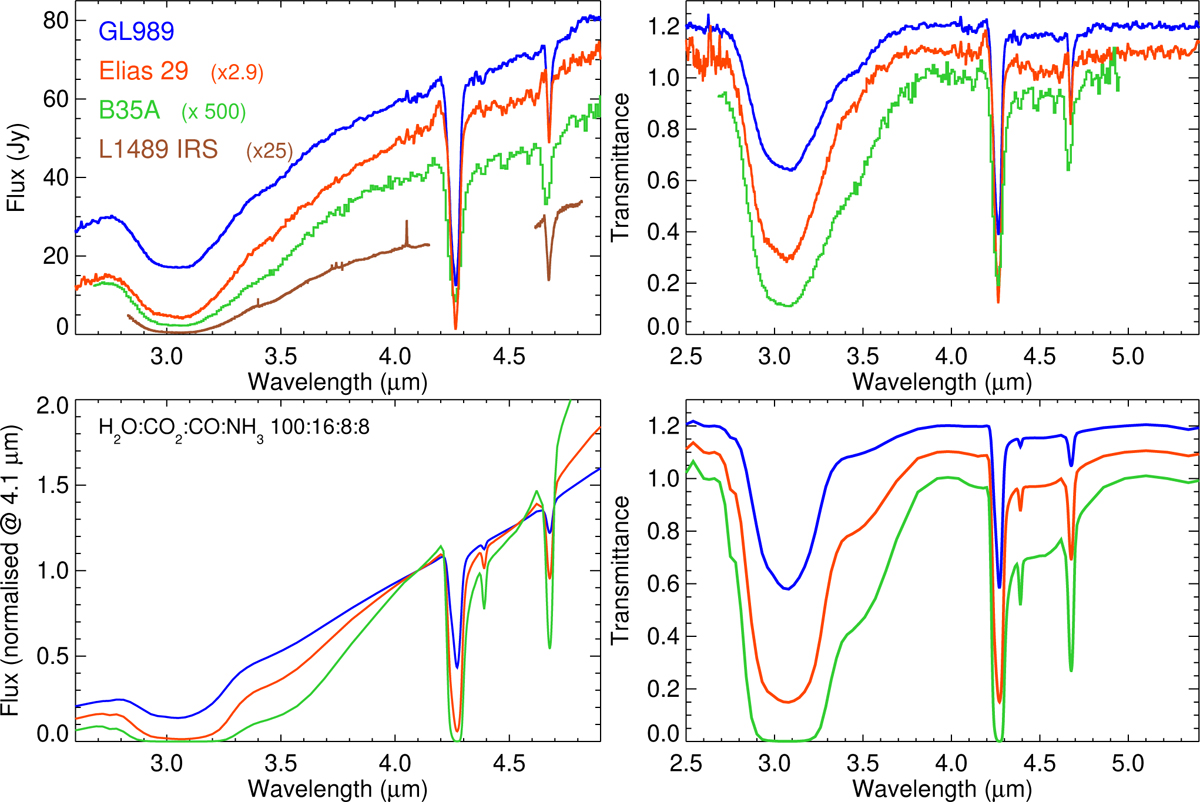
Comparison between YSOs observations and models. Upper left: infrared observations in the H2O, CO2, CO stretching mode region for some sources with available coverage and for which gas-phase CO does not hamper observation of the CO ice profile. GL989 and Elias 29 are from the ISO database, B35A is an Akari spectrum (Noble et al. 2013), L1489 IRS is ground-based high resolution spectra from Boogert et al. (2002). In the L1489 spectrum, the gas-phase CO has been filtered out to show the CO ice profile. Lower left: spherical cloud model spectra with the MX mixture for a τ3 size distribution, for cloud visual extinction of Av = 15 (blue), 30 (red), and 60 (green). The right panels shown the same observations and models after baseline correction to provide transmittance spectra. The blue and red traces have been offset by 0.2 and 0.1, respectively, for clarity.
Current usage metrics show cumulative count of Article Views (full-text article views including HTML views, PDF and ePub downloads, according to the available data) and Abstracts Views on Vision4Press platform.
Data correspond to usage on the plateform after 2015. The current usage metrics is available 48-96 hours after online publication and is updated daily on week days.
Initial download of the metrics may take a while.