Fig. 15
Download original image
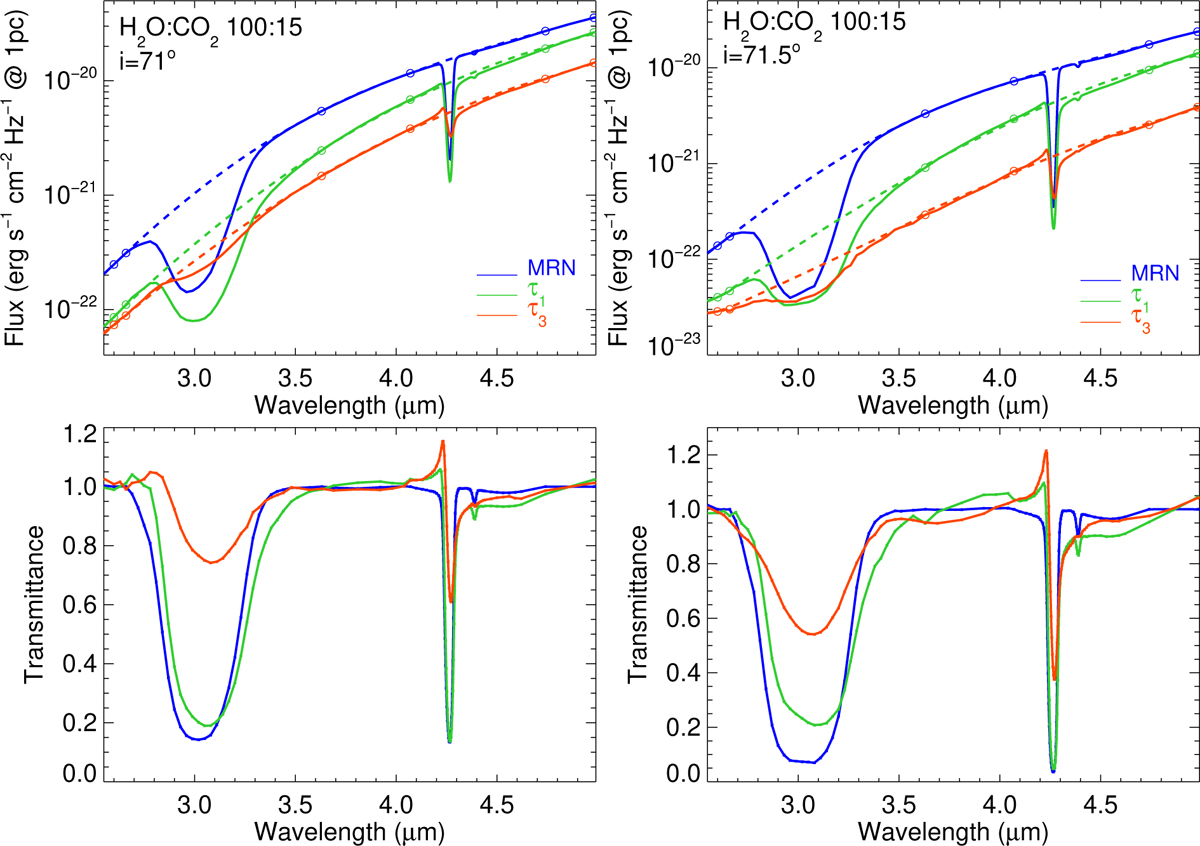
Close-up of the disk radiative transfer models (upper panels) corresponding to silicates core, M15 ice mantle composition and size distribution MRN, amax = 0.25 µm (model #4); τ1, amax = 1 µm (model #5); τ3, amax = 3 µm (model #6); as observed under 71 and 71.5 degrees of inclination, in the water ice and carbon dioxide stretching modes range. A spline continuum passing through the indicated circle points, well apart from the core of the ice bands, is overlaid (dashed line). Lower panels show the extracted resulting transmittance spectra after dividing by this estimated continuum. In the highest optical depth spectrum (i = 71.5°, τ3) both the calculated spectrum and a slightly numerical noise filtered spectrum are shown. The asymmetry of the water ice band as well as the shift in the band centre are evidenced and accompanies the observed higher contrast CO2 profile deformation.
Current usage metrics show cumulative count of Article Views (full-text article views including HTML views, PDF and ePub downloads, according to the available data) and Abstracts Views on Vision4Press platform.
Data correspond to usage on the plateform after 2015. The current usage metrics is available 48-96 hours after online publication and is updated daily on week days.
Initial download of the metrics may take a while.