Fig. 1.
Download original image
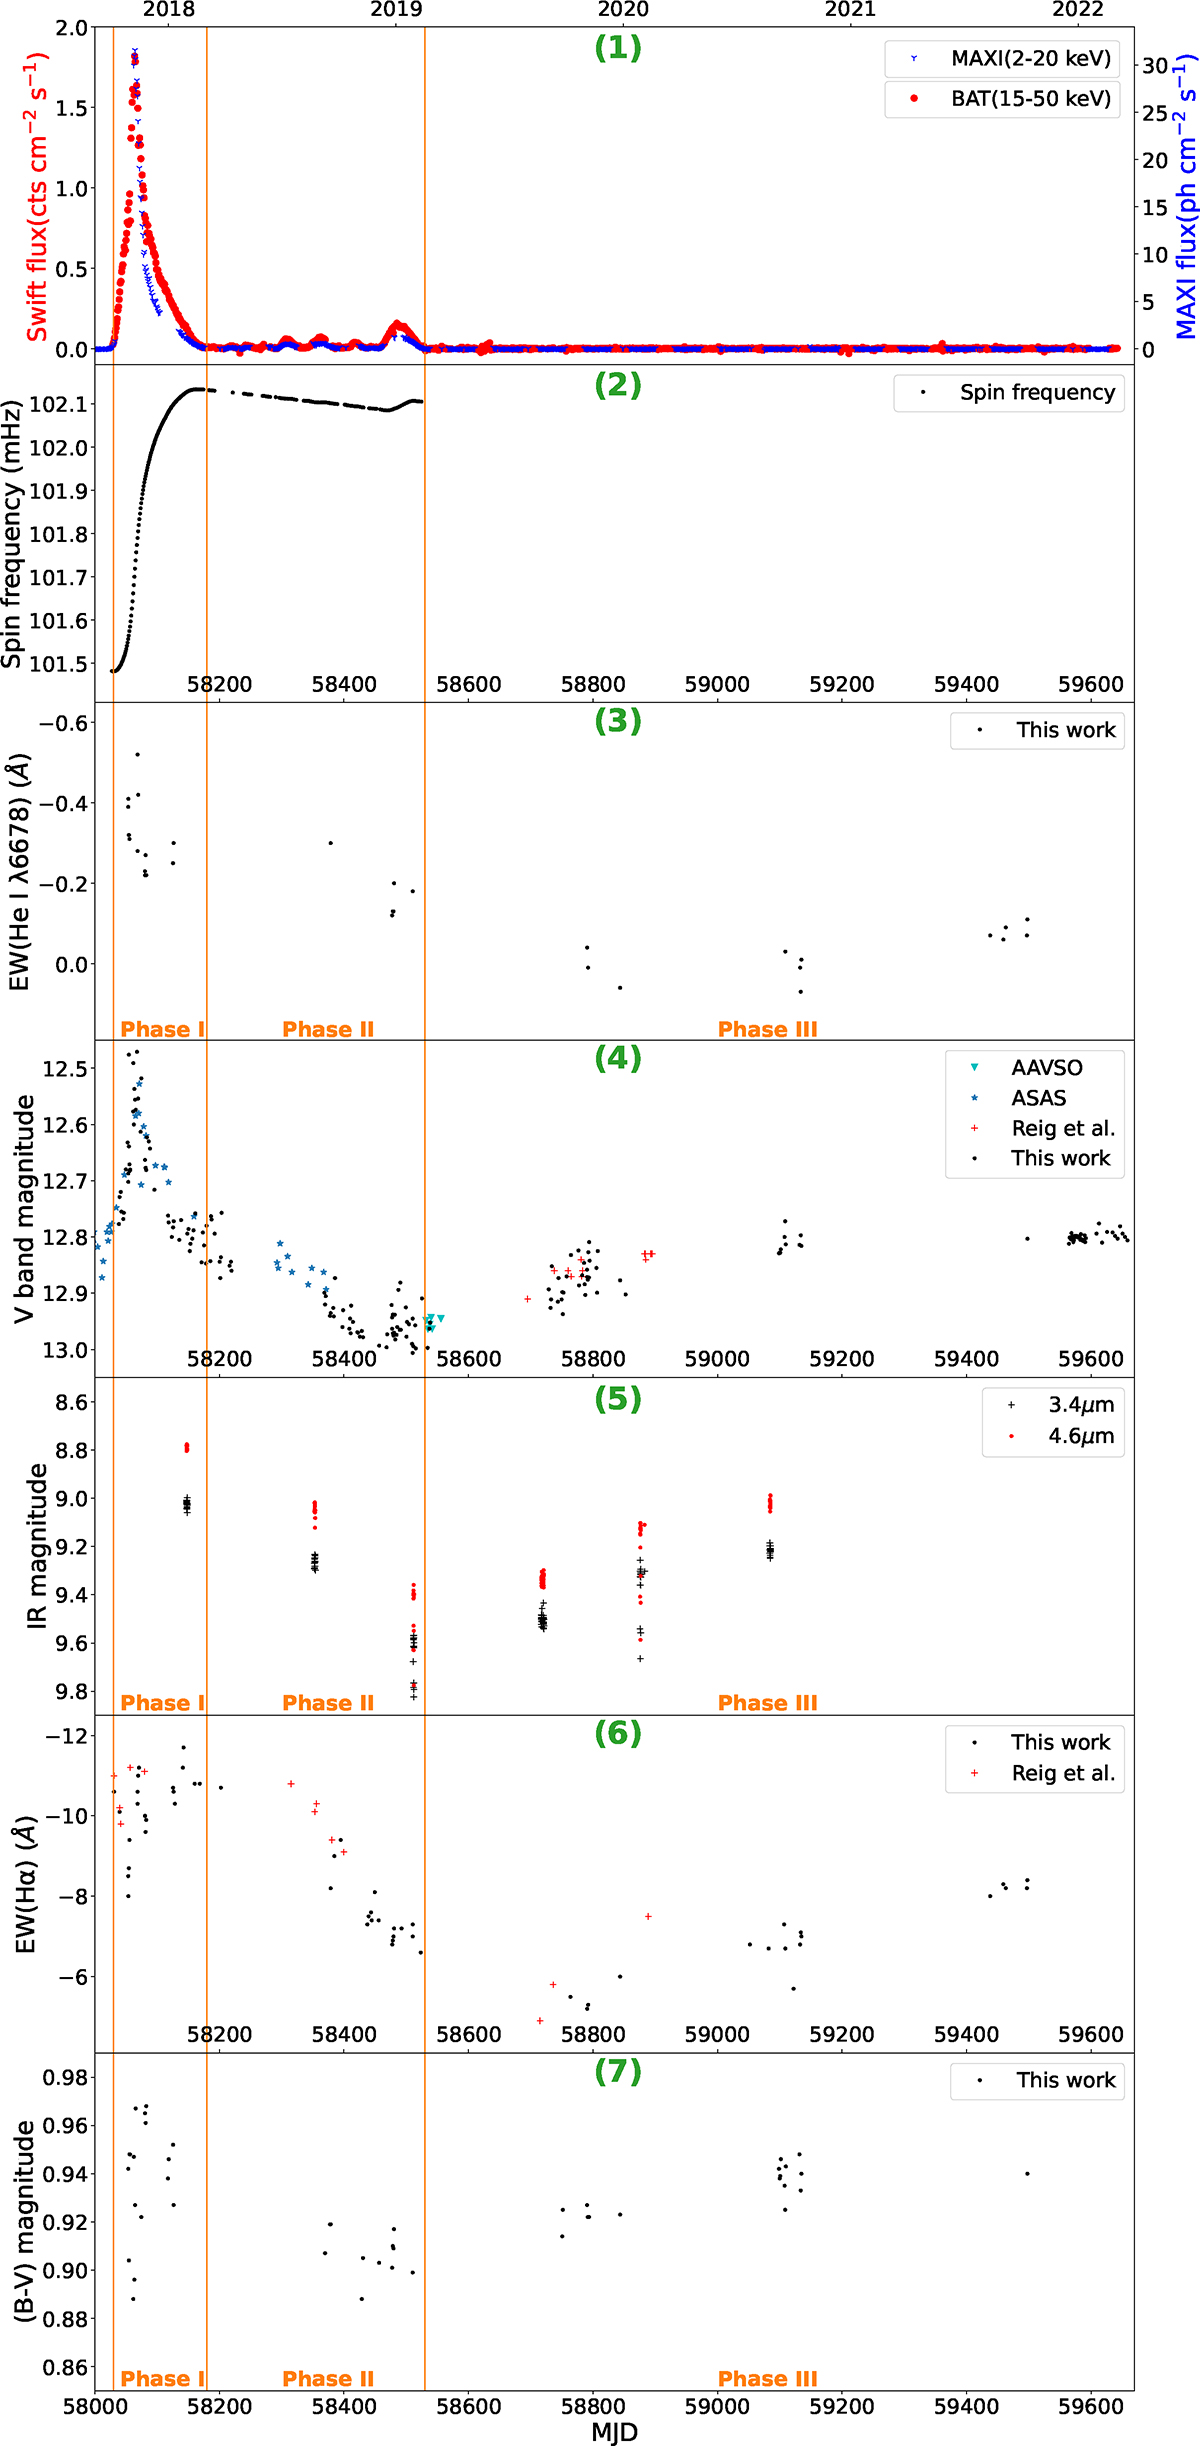
Long-term variations of Swift J0243.6+6124 from 2017 to 2022. First panel: X-ray band light curves. The data from Swift/BAT (15–50 keV) and MAXI (2–20 keV) are labeled with red points and blue downward triangles, respectively. The first day of each year is also marked at the top of the first panel in the format YYYY. Second panel: barycentered and orbit-corrected spin-frequency history measured with Fermi/GBM. Third panel: equivalent widths of He I λ6678 lines. Fourth panel: long-term light curves of the optical V band from AAVSO, ASAS-SN, Reig et al. (2020), and this work. They are separately labeled with light green downward triangles, blue stars, red plus signs, and black points. Fifth panel: long-term light curves of NEOWISE infrared magnitudes at 3.4 μm and 4.6 μm. They are labeled with black plus signs and red points, respectively. Sixth panel: equivalent widths of Hα lines from this work and Reig et al. (2020). They are labeled with black points and red plus signs, respectively. Seventh panel: evolution of the (B − V) color index. The vertical lines separate the three phases into which the observations are divided.
Current usage metrics show cumulative count of Article Views (full-text article views including HTML views, PDF and ePub downloads, according to the available data) and Abstracts Views on Vision4Press platform.
Data correspond to usage on the plateform after 2015. The current usage metrics is available 48-96 hours after online publication and is updated daily on week days.
Initial download of the metrics may take a while.