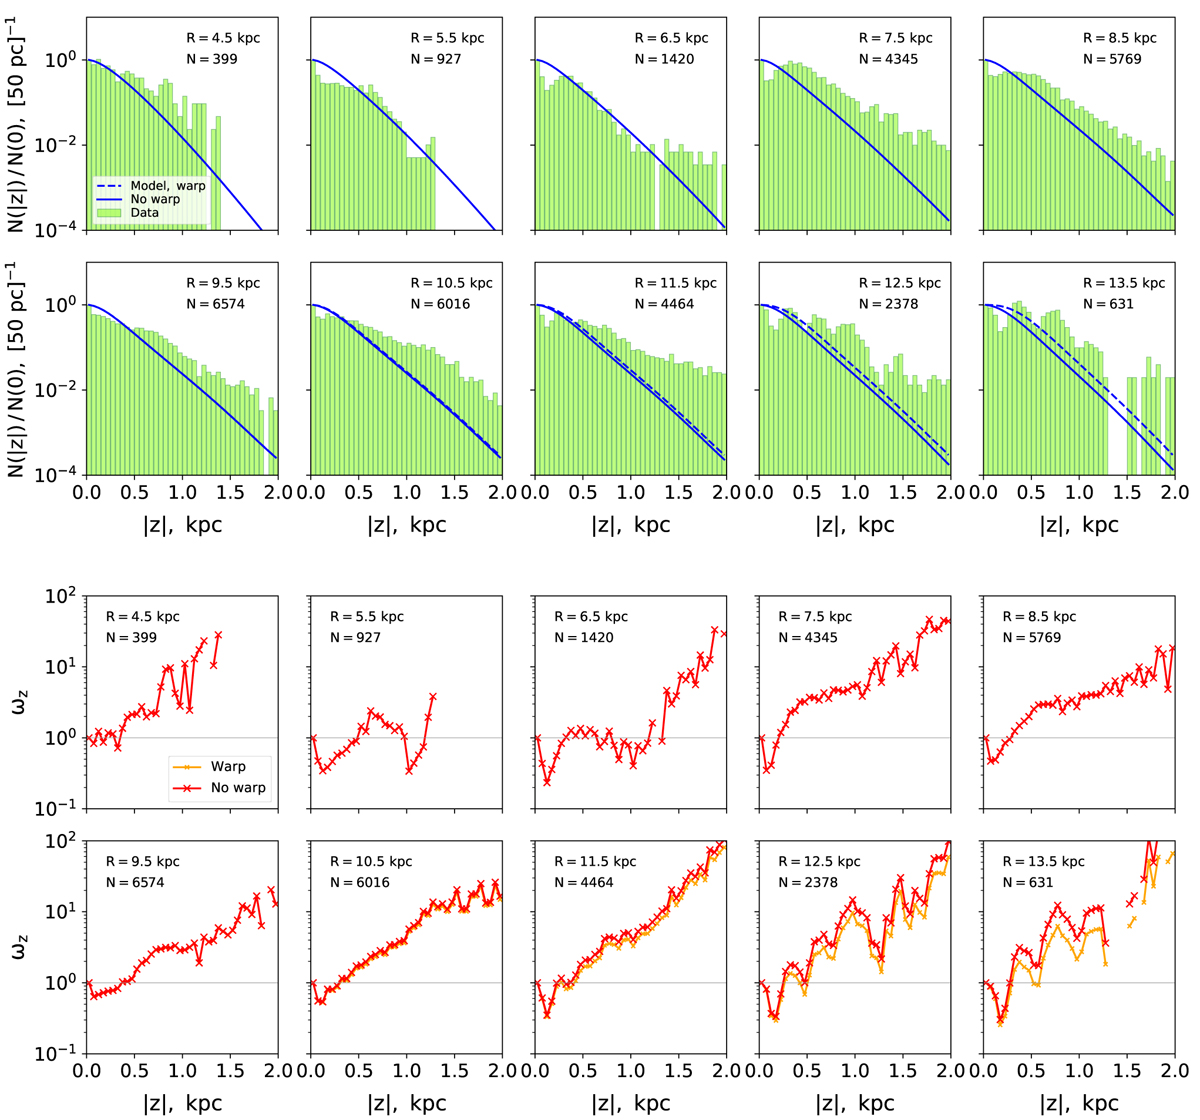
Fig. 7.
Download original image
Spatial selection function of the thin-disk RC sample. Top: observed (green histogram) and predicted (blue curves) number density laws of a complete sample in R bins. Modelled profiles with the disk warp taken into account are shown in dashed blue. Both observed and modelled density laws are normalised to the midplane densities. Bottom: z weights calculated as a ratio of the observed to modelled profiles. The grey line marks ωz = 1, the case of a complete sample.
Current usage metrics show cumulative count of Article Views (full-text article views including HTML views, PDF and ePub downloads, according to the available data) and Abstracts Views on Vision4Press platform.
Data correspond to usage on the plateform after 2015. The current usage metrics is available 48-96 hours after online publication and is updated daily on week days.
Initial download of the metrics may take a while.