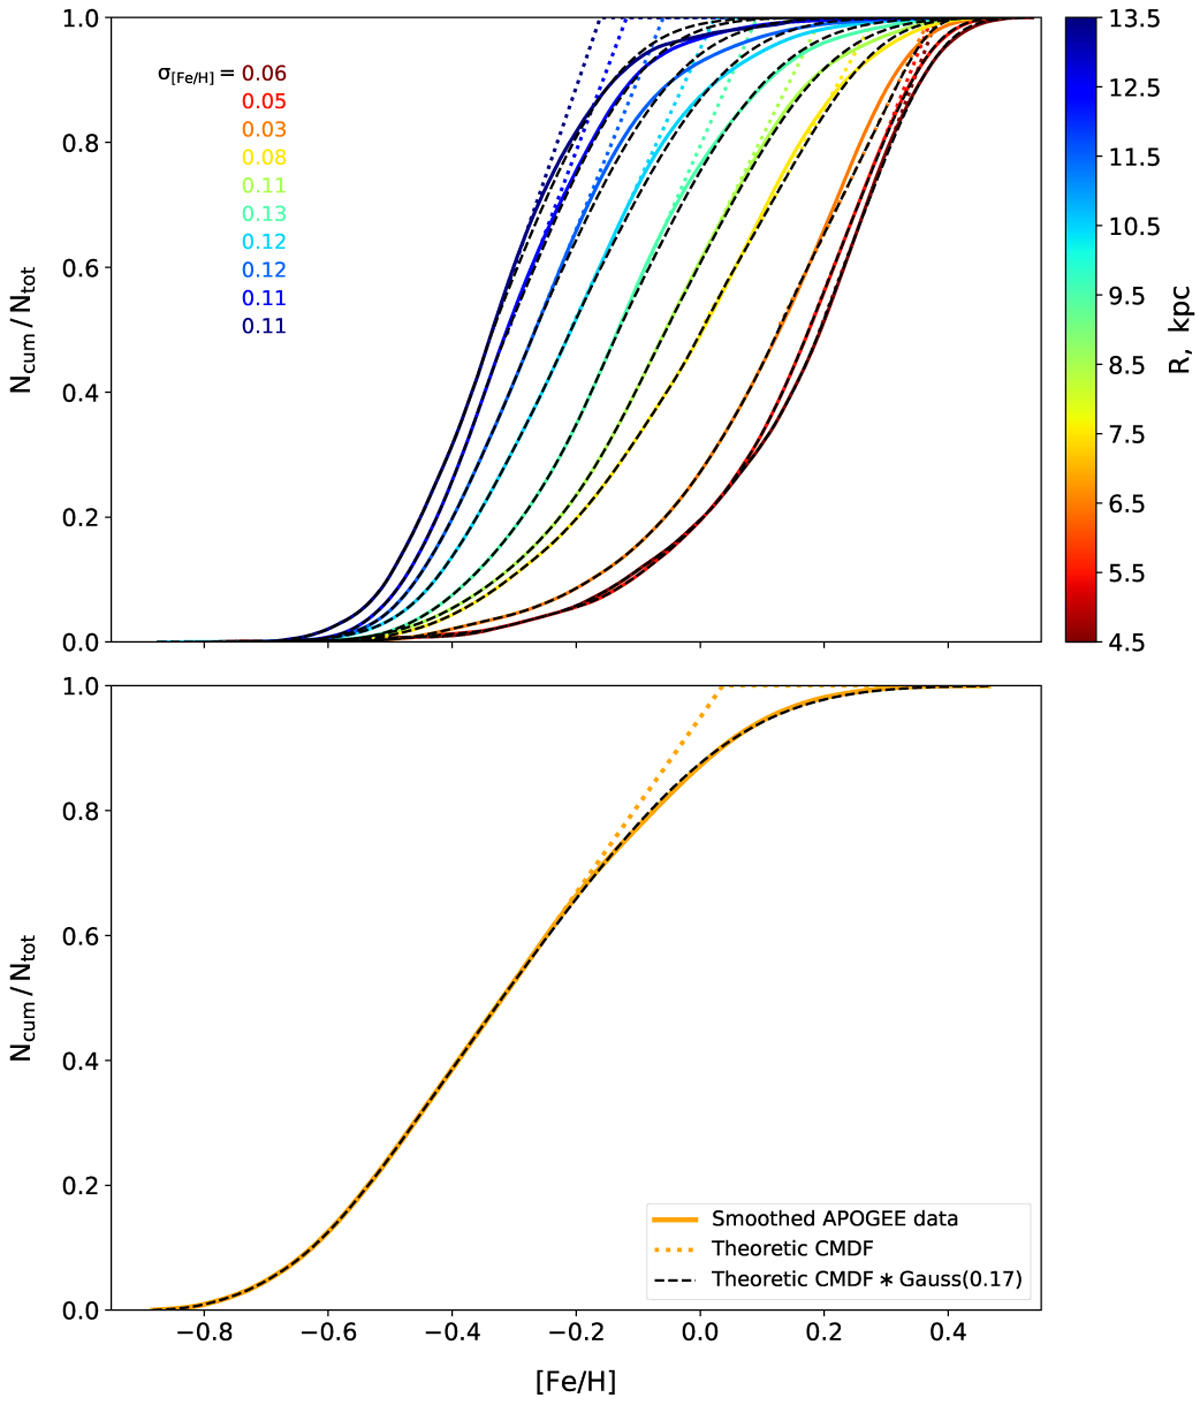
Fig. 6.
Download original image
CMDFs of the APOGEE RC samples. Top: low-α CMDFs calculated in the different radial bins (run0 grid). Dotted coloured curves are CMDFs with extrapolated linear parts. Dashed black curves are C([Fe/H]), convolutions of the ‘deconvolved’ CMDFs with the Gaussian kernel (Eq. (20)). The kernel dispersions σ[Fe/H] are shown on the plot with the same colour coding. Bottom: same as the top panel, but for the high-α stars and no radial binning.
Current usage metrics show cumulative count of Article Views (full-text article views including HTML views, PDF and ePub downloads, according to the available data) and Abstracts Views on Vision4Press platform.
Data correspond to usage on the plateform after 2015. The current usage metrics is available 48-96 hours after online publication and is updated daily on week days.
Initial download of the metrics may take a while.