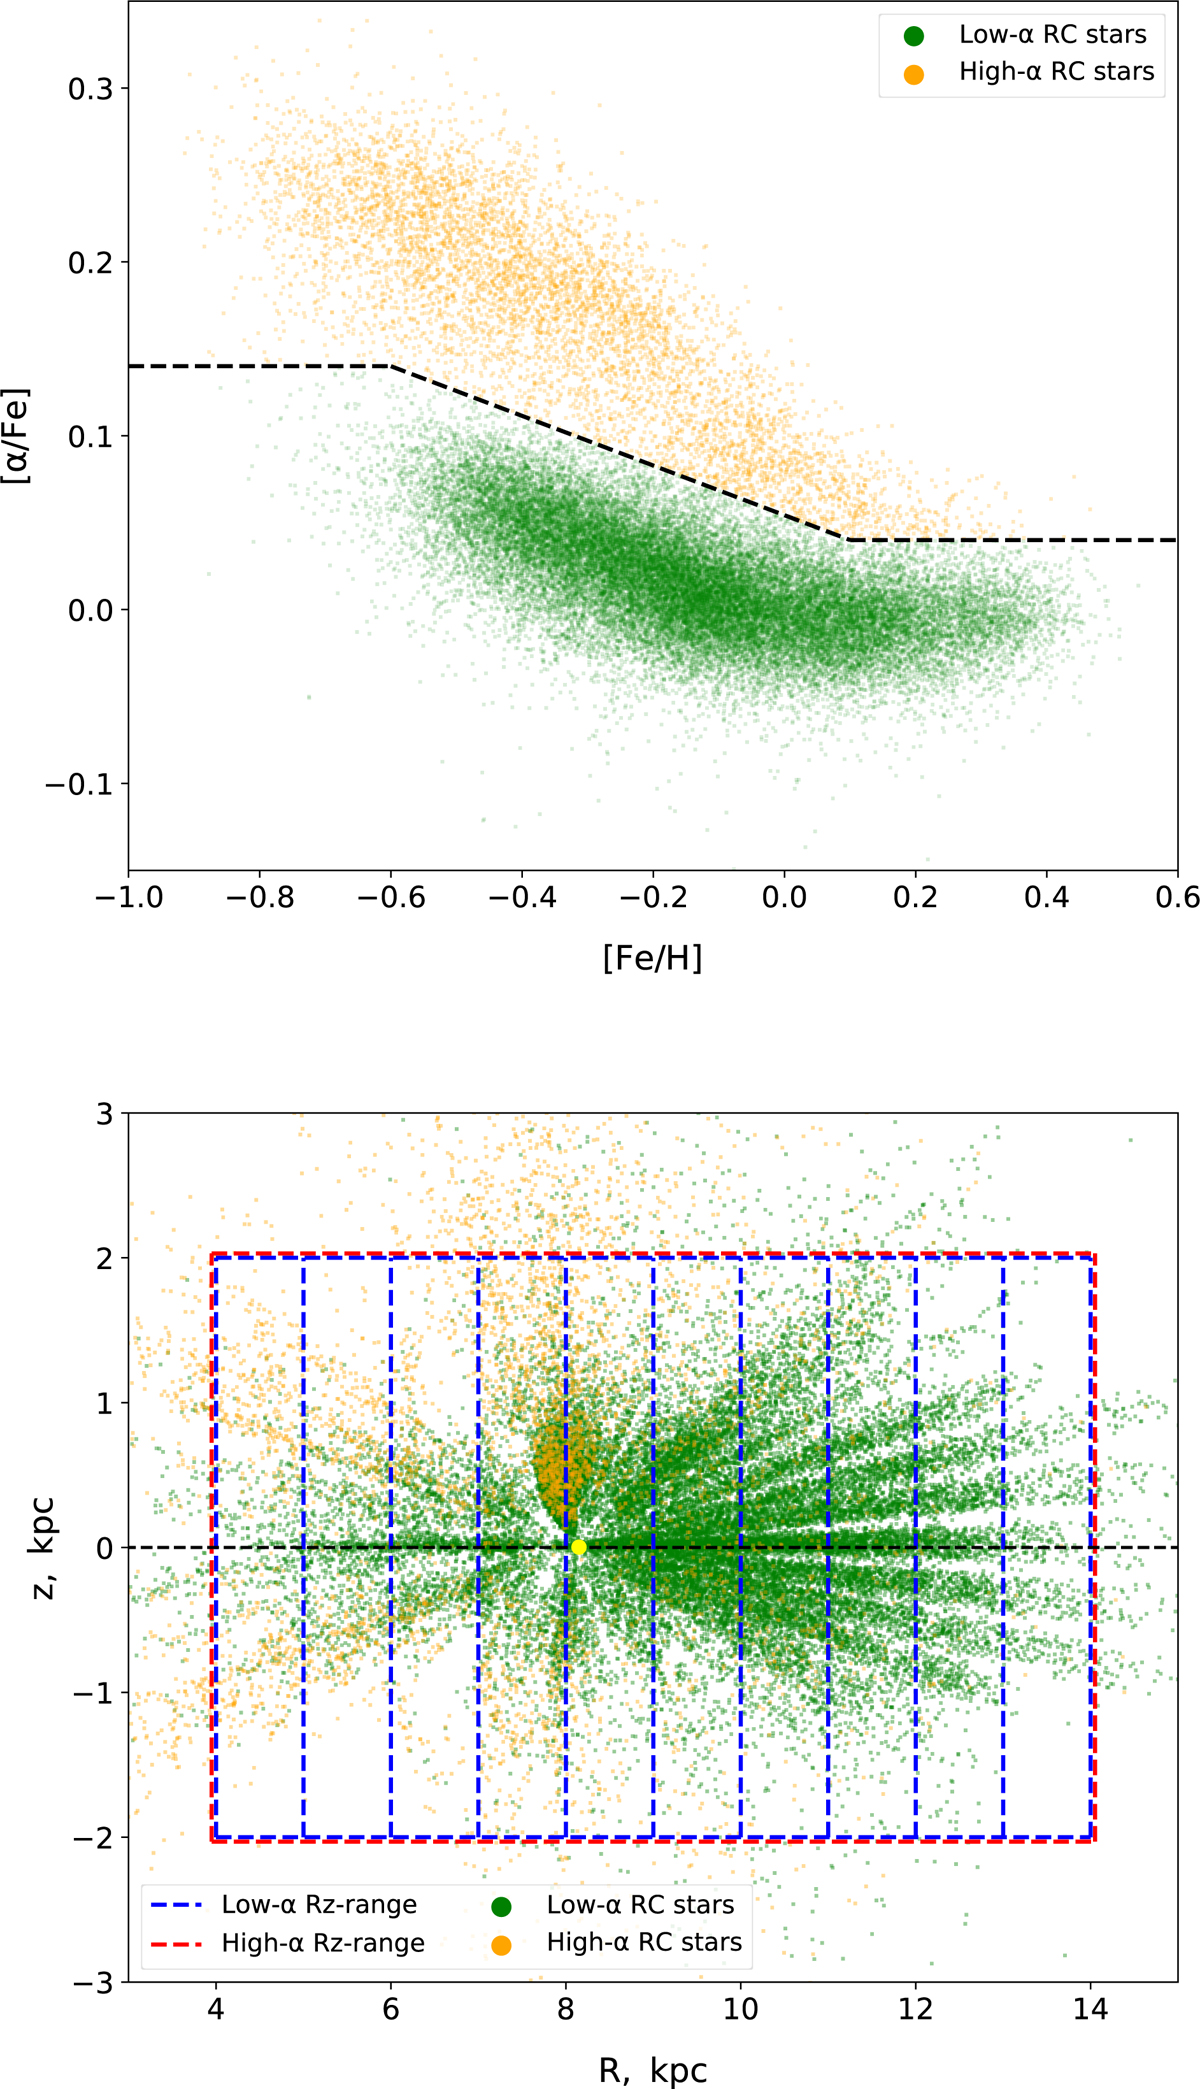
Fig. 5.
Download original image
Selection of the APOGEE RC samples. Top: low-α (green) and high-α (orange) RC sequences. The separation border corresponding to Eq. (19) is shown with dashed black line. Bottom: selected low-α and high-α RC populations in the R-z plane. Dashed lines mark the adopted limits for the galactocentric distance and height. The radial binning of the low-α population corresponds to run0 (see text). The adopted position of the Sun is marked with a yellow dot.
Current usage metrics show cumulative count of Article Views (full-text article views including HTML views, PDF and ePub downloads, according to the available data) and Abstracts Views on Vision4Press platform.
Data correspond to usage on the plateform after 2015. The current usage metrics is available 48-96 hours after online publication and is updated daily on week days.
Initial download of the metrics may take a while.