Open Access
Fig. 2.
Download original image
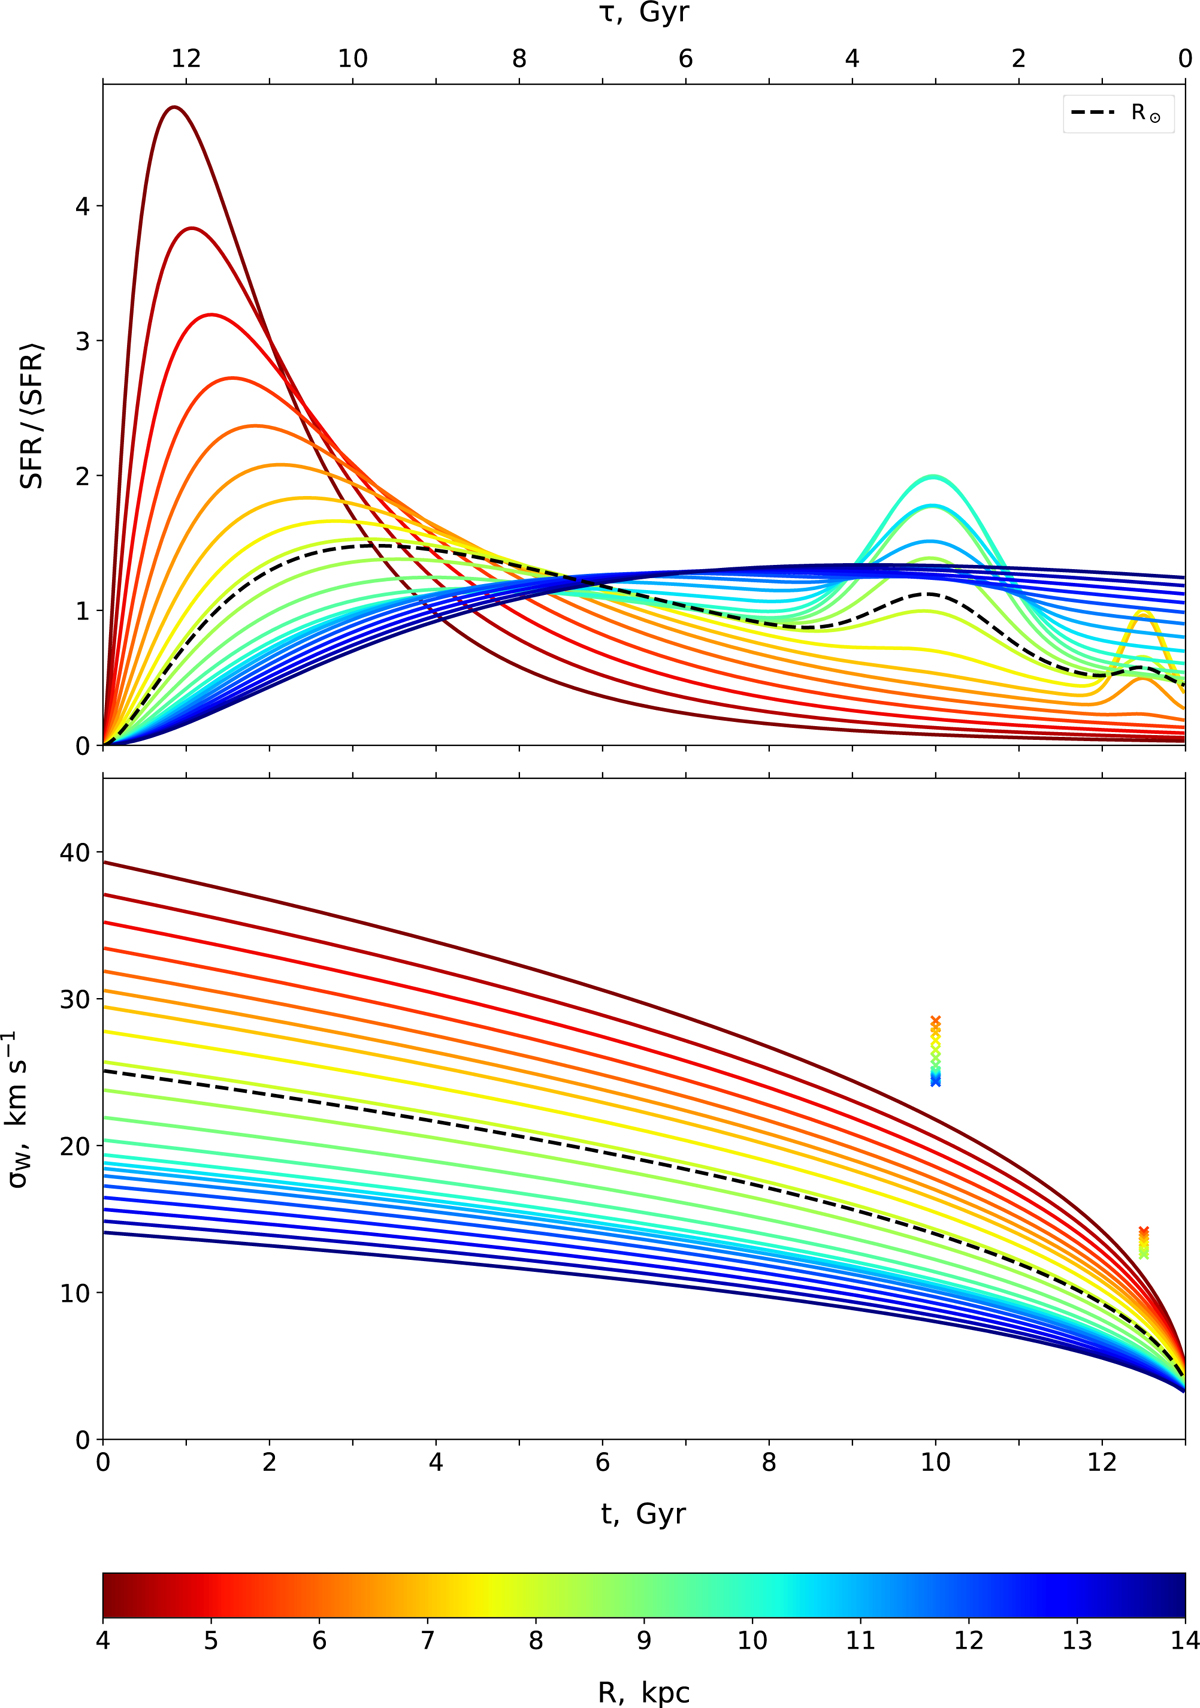
Thin-disk SFR (top) and AVR (bottom) as functions of radius. Dashed black curves correspond to the solar neighbourhood. Crosses give the vertical velocity dispersion corresponding to the fractions of sub-populations associated with the extra SFR peaks. For the details of this model realisation, see Sect. 3.1.
Current usage metrics show cumulative count of Article Views (full-text article views including HTML views, PDF and ePub downloads, according to the available data) and Abstracts Views on Vision4Press platform.
Data correspond to usage on the plateform after 2015. The current usage metrics is available 48-96 hours after online publication and is updated daily on week days.
Initial download of the metrics may take a while.