Open Access
Fig. 10.
Download original image
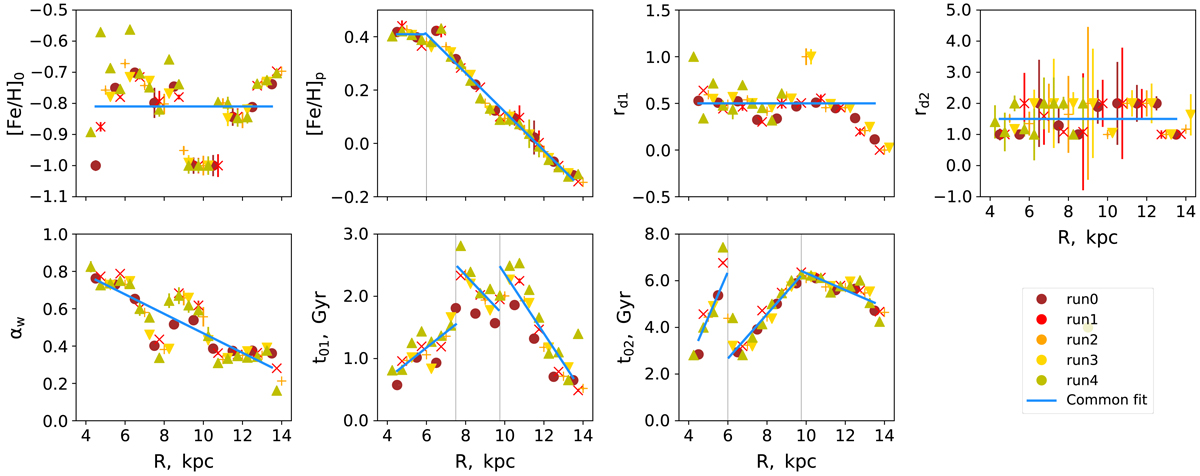
Best-fit parameters of the thin-disk AMR. Different colours and symbols correspond to the five radial grids (run0–run4). Vertical grey lines mark the break-point positions. Blue lines are the overall fits of the radial trends.
Current usage metrics show cumulative count of Article Views (full-text article views including HTML views, PDF and ePub downloads, according to the available data) and Abstracts Views on Vision4Press platform.
Data correspond to usage on the plateform after 2015. The current usage metrics is available 48-96 hours after online publication and is updated daily on week days.
Initial download of the metrics may take a while.