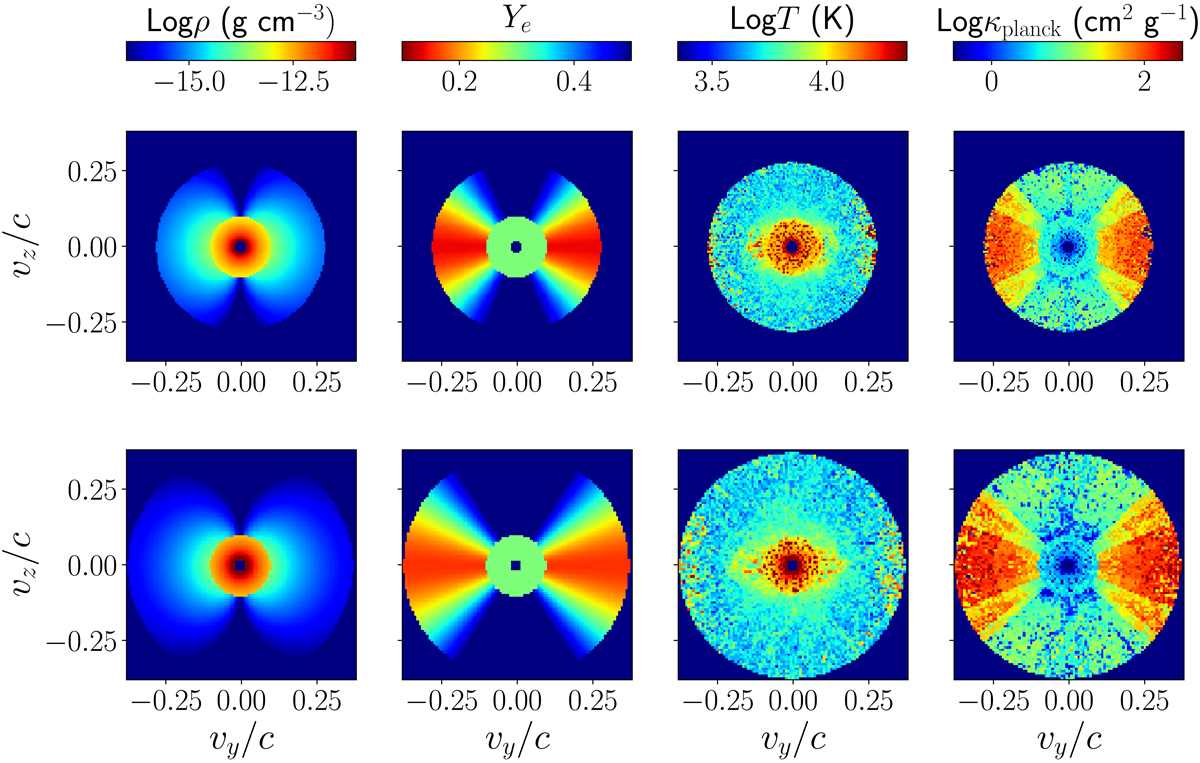
Fig. 5.
Download original image
From left to right: distributions of mass density ρ, electron fraction Ye, temperature T and Planck mean opacities κPlanck in the vy − vz velocity plane. The top row refers to run A (LS220 EoS) and the bottom row to run B (DD2 EoS), both with q = 1 and Mchirp = 1.188 M⊙, see Table 1. Maps are computed at an epoch of 1 d after the merger. The pixelization seen in the T (and hence also κPlanck) map is due to the temperature being computed with estimators in the code and thus being subject to Monte Carlo noise (see text for more details). Analytic functions are instead used for ρ and Ye and the distributions are therefore smoother.
Current usage metrics show cumulative count of Article Views (full-text article views including HTML views, PDF and ePub downloads, according to the available data) and Abstracts Views on Vision4Press platform.
Data correspond to usage on the plateform after 2015. The current usage metrics is available 48-96 hours after online publication and is updated daily on week days.
Initial download of the metrics may take a while.