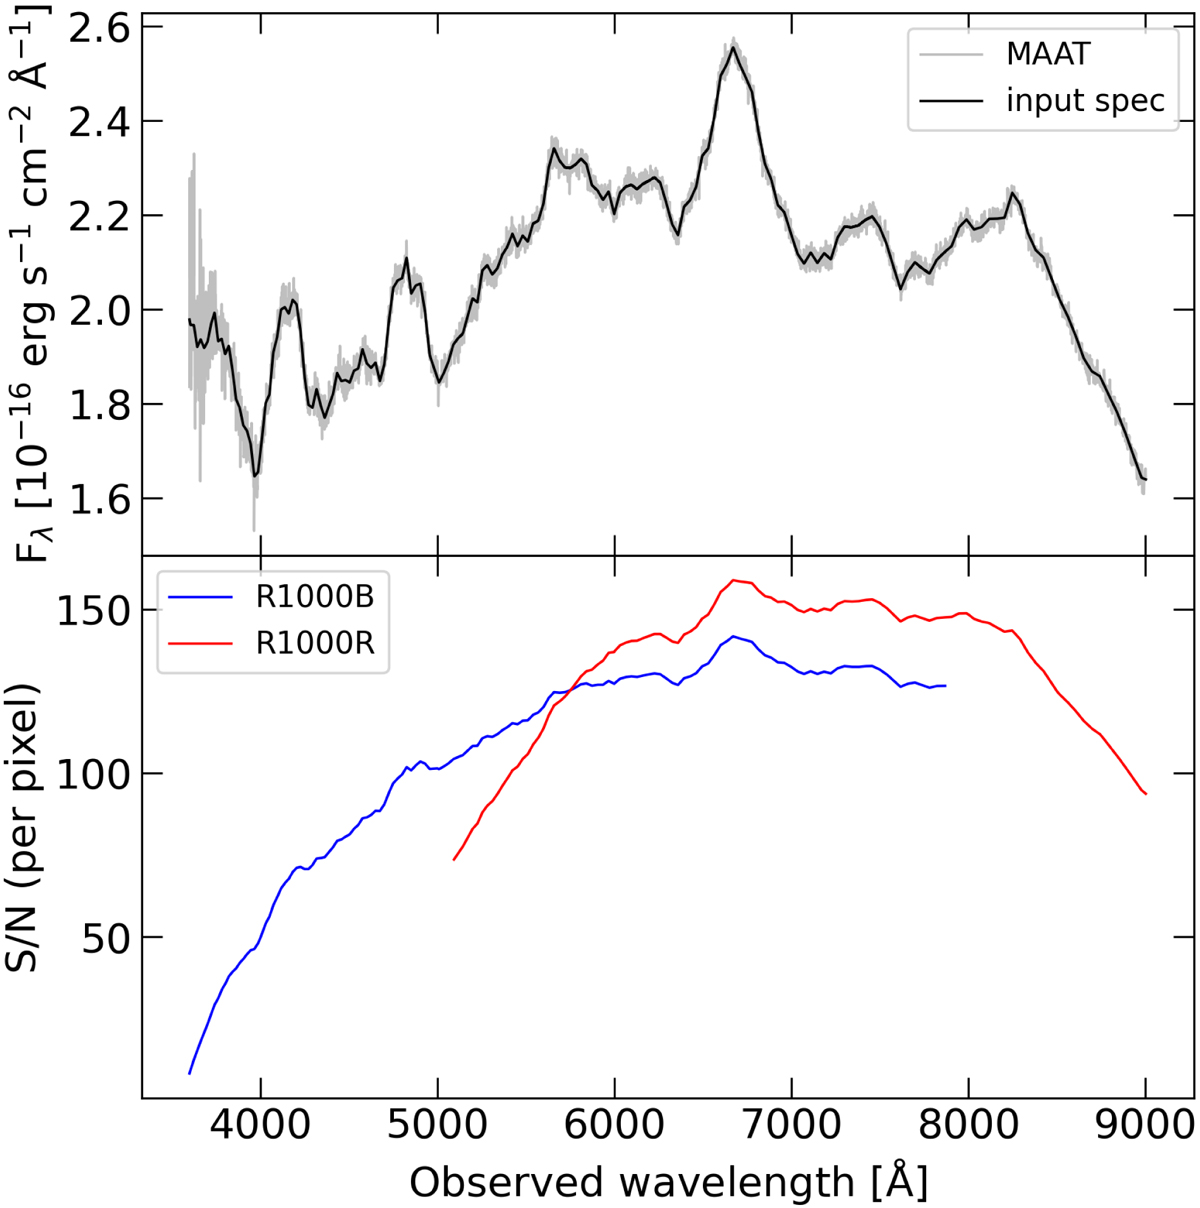
Fig. 4.
Download original image
Simulated KN spectral emission for an event similar to AT 2017gfo at ∼1 day as observed with MAAT using the R1000B and R1000R gratings and a total exposure time of 1800 s. Top panel: resulted observed spectra (grey) compared to the theoretical input from KN run 1 simulation (black) with EoS DD2, see Table 1, assuming similar parameters to those associated to GW170817 at 40 Mpc. The bottom panel shows the S/N obtained for the simulated event for gratings R1000B (blue) and R1000R (red). Note that the top spectrum is the combination of the flux captured by both red (R) and blue (B) R1000 gratings.
Current usage metrics show cumulative count of Article Views (full-text article views including HTML views, PDF and ePub downloads, according to the available data) and Abstracts Views on Vision4Press platform.
Data correspond to usage on the plateform after 2015. The current usage metrics is available 48-96 hours after online publication and is updated daily on week days.
Initial download of the metrics may take a while.