Open Access
Fig. 3.
Download original image
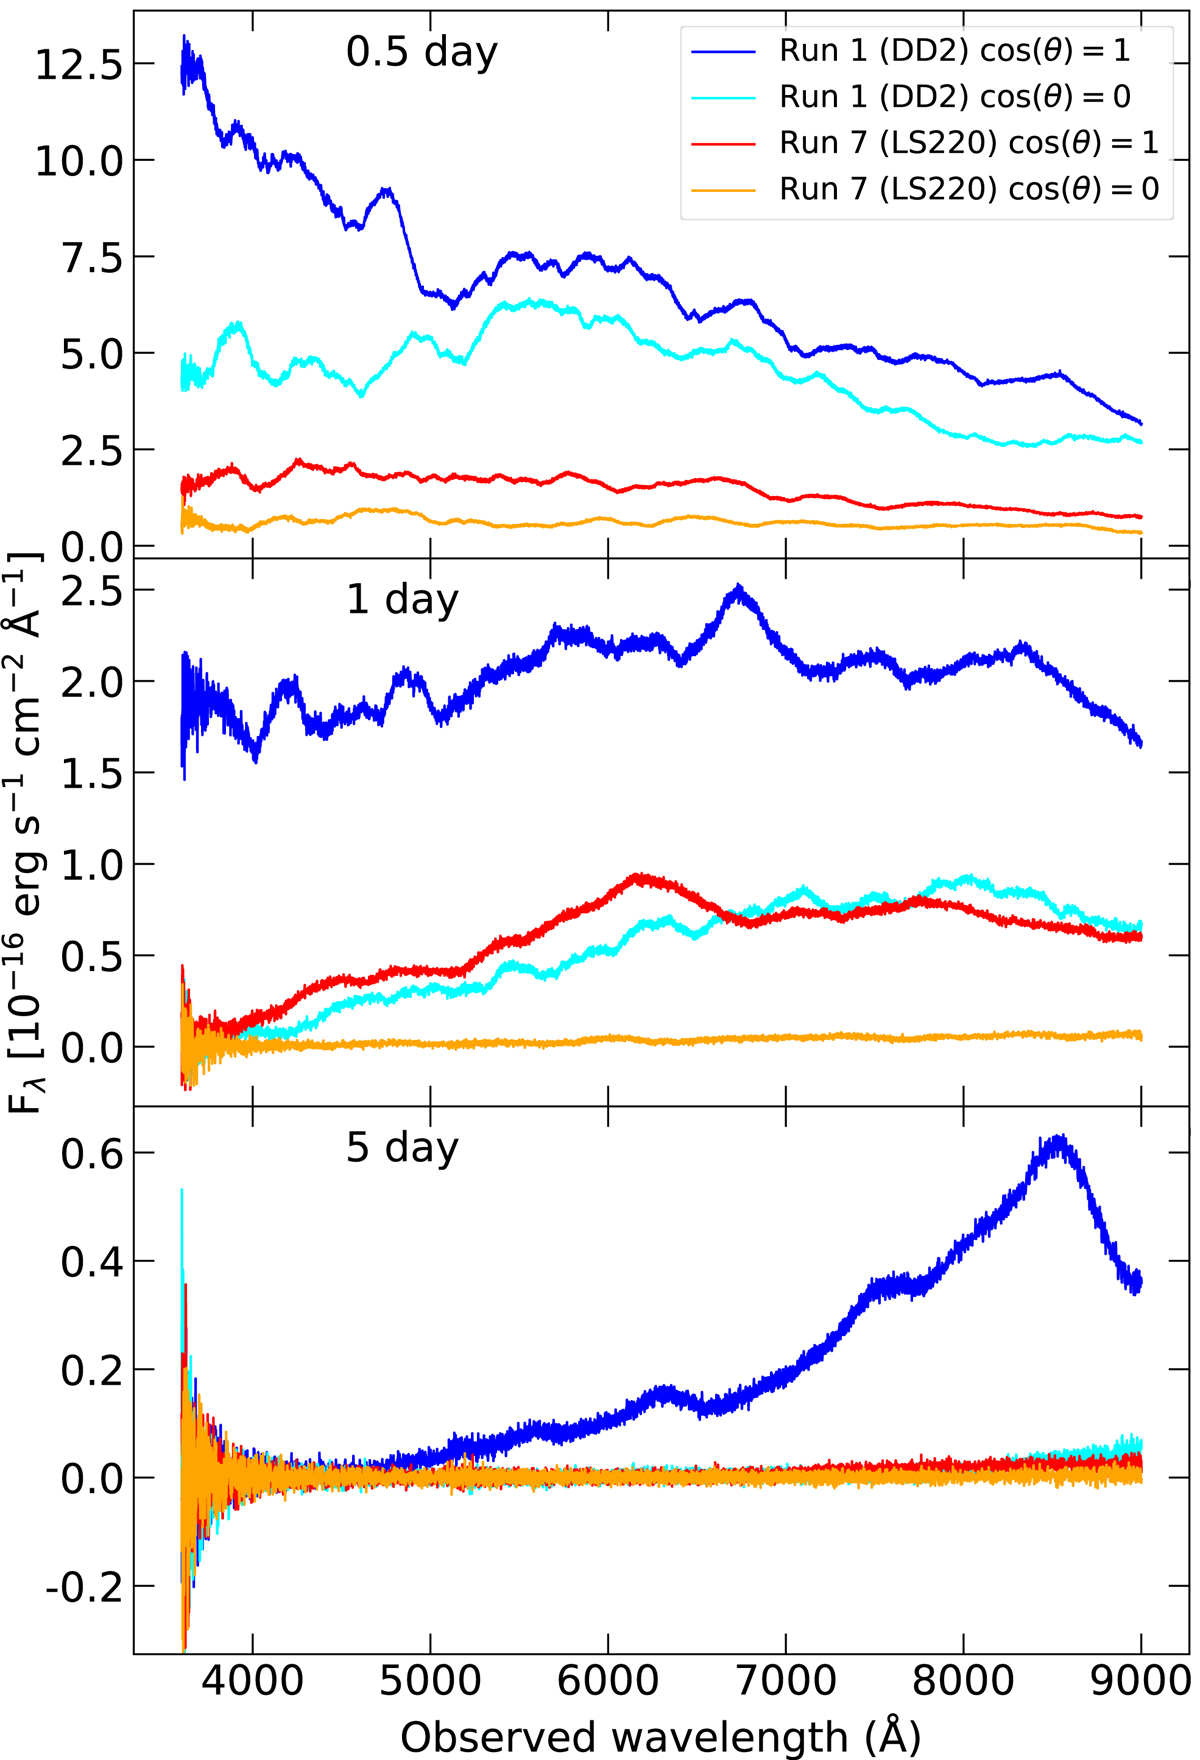
Absolute flux obtained at t = 0.5, 1, 5 days after the merger as seen by MAAT using R1000B and R1000R gratings. We plot run 1 (EoS DD2) for a polar and equatorial observer (dark and pale blue lines). Same for run 7 (EoS LS220) for a polar and equatorial observer (red and orange lines). A distance of 40 Mpc is assumed.
Current usage metrics show cumulative count of Article Views (full-text article views including HTML views, PDF and ePub downloads, according to the available data) and Abstracts Views on Vision4Press platform.
Data correspond to usage on the plateform after 2015. The current usage metrics is available 48-96 hours after online publication and is updated daily on week days.
Initial download of the metrics may take a while.