Fig. 17.
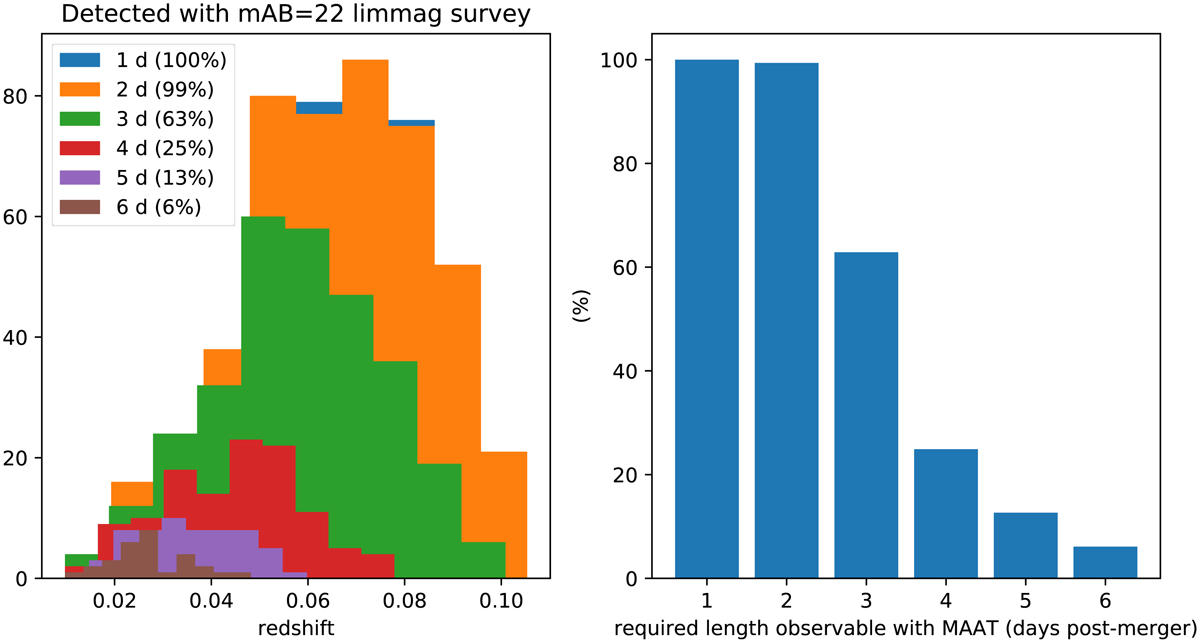
Download original image
Left panel: redshift distribution on simulated KNe detected by a generic optical survey with a nominal depth of ∼22 mag, and each color shows the distribution dependence on the detectability per redshift with the start time of the observations. The numbers in parenthesis present the ratio at which the detectability decays with time. Right panel: ratio of KNe discovered by a 22 mag depth optical survey that is detectable by MAAT per post-merger epoch. MAAT would be able to follow up on most of the KNe, if not all, that would appear on the observable area. For this computation, a model similar to AT 2017gfo KN was used to distribute inclination angles uniformly in cos(θ).
Current usage metrics show cumulative count of Article Views (full-text article views including HTML views, PDF and ePub downloads, according to the available data) and Abstracts Views on Vision4Press platform.
Data correspond to usage on the plateform after 2015. The current usage metrics is available 48-96 hours after online publication and is updated daily on week days.
Initial download of the metrics may take a while.