Fig. 8.
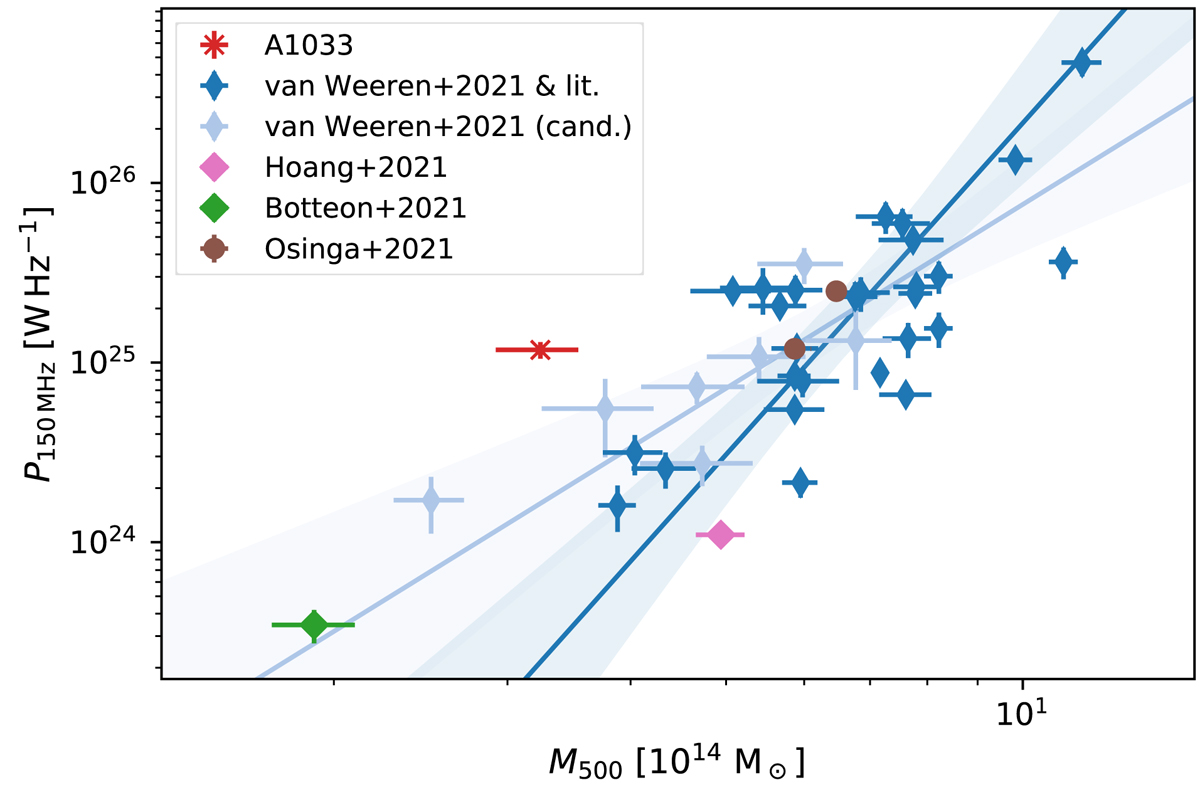
Download original image
Radio power at 150 MHz of low-frequency radio halos as a function of the PSZ2 mass. The lines indicate the extreme cases of the correlations of radio power to cluster mass reported in van Weeren et al. (2021), which were derived using different fitting methods and samples. The dark blue line shows the steepest (orthogonal method) and the light blue line shows the flattest (including candidate halos, Y|X method) correlation. The shaded regions show the 95% confidence interval. The halos reported as ‘van Weeren+21 & lit.’ include a literature radio halo sample (de Gasperin et al. 2015; Cordey 1985; Wilber et al. 2018; Botteon et al. 2019; Bîrzan et al. 2019; Savini et al. 2018, 2019; Bonafede et al. 2018; Hoang et al. 2019a,b; Macario et al. 2013; George et al. 2017; Duchesne et al. 2021).
Current usage metrics show cumulative count of Article Views (full-text article views including HTML views, PDF and ePub downloads, according to the available data) and Abstracts Views on Vision4Press platform.
Data correspond to usage on the plateform after 2015. The current usage metrics is available 48-96 hours after online publication and is updated daily on week days.
Initial download of the metrics may take a while.