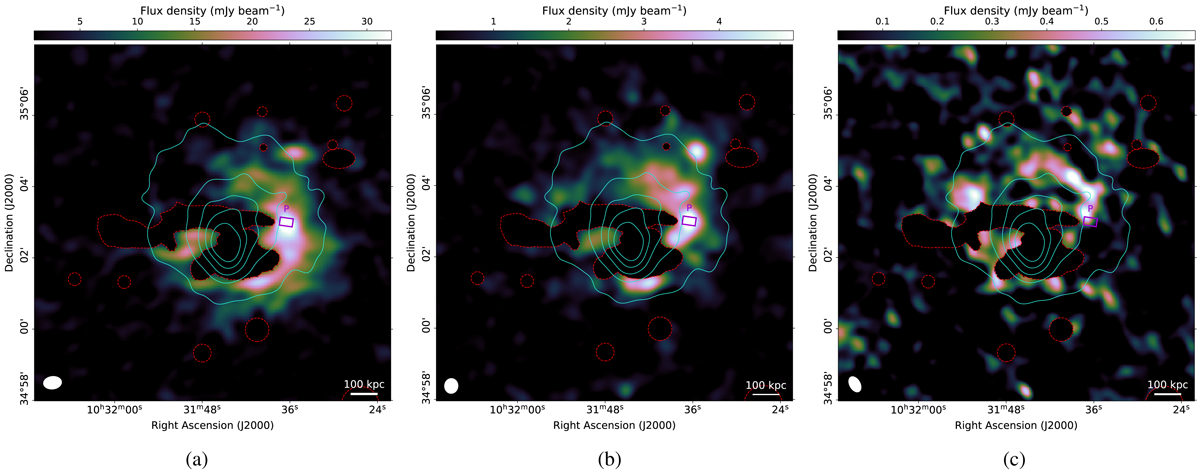
Fig. 6.
Download original image
Source-subtracted low-resolution images. The image weights are tapered to a resolution of 25″. Red contours indicate sources that were subtracted from the data, and cyan contours are smoothed Chandra X-ray contours in the energy band 0.5−7 keV (de Gasperin et al. 2015), linearly spaced between 10−100σ, where 1σ = 6.6 × 10⁻⁶ photons s−1 cm−2 arcmin−2. The purple rectangle labeled P marks the brightest part of the visible halo. (a) 54 MHz, (b) 144 MHZ, (c) 325 MHZ.
Current usage metrics show cumulative count of Article Views (full-text article views including HTML views, PDF and ePub downloads, according to the available data) and Abstracts Views on Vision4Press platform.
Data correspond to usage on the plateform after 2015. The current usage metrics is available 48-96 hours after online publication and is updated daily on week days.
Initial download of the metrics may take a while.