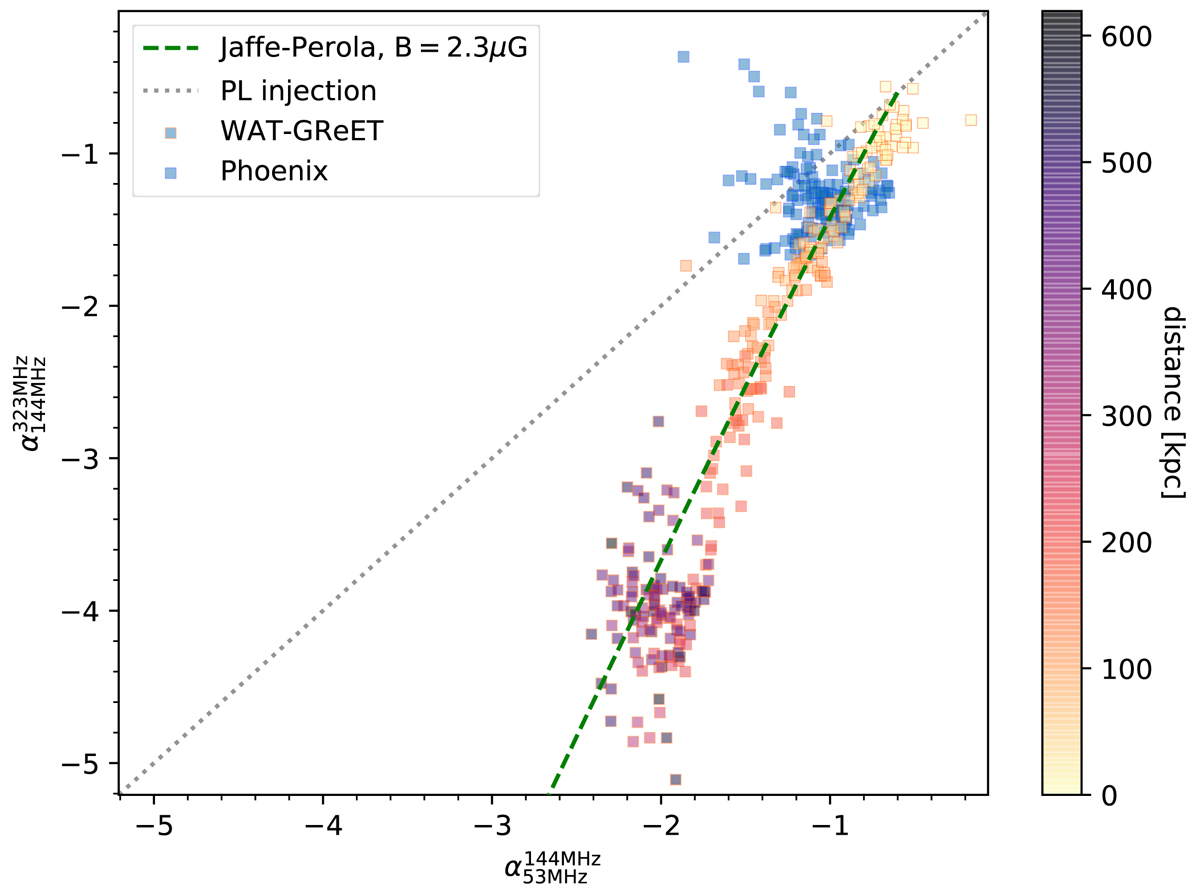
Fig. 5.
Download original image
Color-color plot of A1033. Each square represents a 5″ × 5″ region of the WAT/GReET (orange edges) or phoenix (blue). For the WAT/GReeT area, the square faces are color-coded according to their approximate distance from the injection point. Additionally, two lines show the spectral properties for a power-law injection (dotted gray) and for a JP aging model with B = 2.3 μG (dashed green).
Current usage metrics show cumulative count of Article Views (full-text article views including HTML views, PDF and ePub downloads, according to the available data) and Abstracts Views on Vision4Press platform.
Data correspond to usage on the plateform after 2015. The current usage metrics is available 48-96 hours after online publication and is updated daily on week days.
Initial download of the metrics may take a while.