Fig. 4.
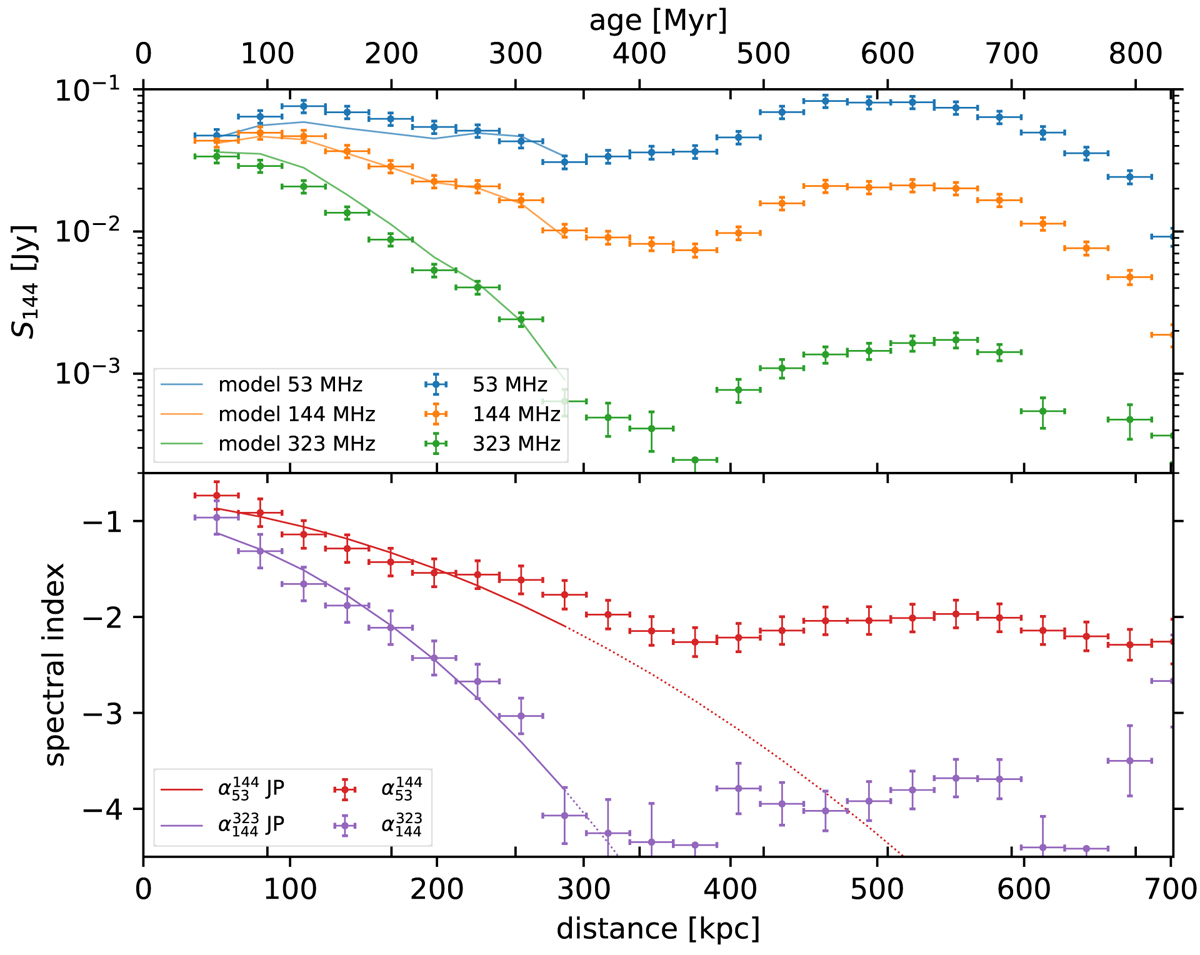
Download original image
Flux density (top) and spectral index (bottom) measured in the 12.5″ beam-sized regions shown in Fig. 2 as a function of distance and estimated age. The continuous lines show the best-fitting model (χ2/d.o.f. = 29.5/17) assuming minimum aging (B = 2.3 μG) with a projected velocity of 780 km s−1. The dotted lines show an extrapolation of this model.
Current usage metrics show cumulative count of Article Views (full-text article views including HTML views, PDF and ePub downloads, according to the available data) and Abstracts Views on Vision4Press platform.
Data correspond to usage on the plateform after 2015. The current usage metrics is available 48-96 hours after online publication and is updated daily on week days.
Initial download of the metrics may take a while.