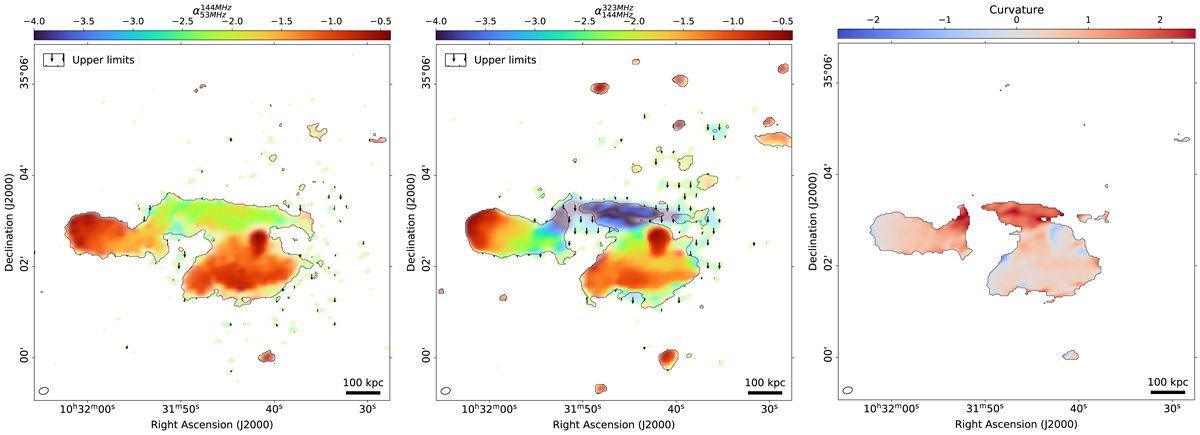
Fig. 3.
Download original image
High-resolution spectral index map of A1033. Left image: spectral index between 54 and 144 MHz, and right image: same between 144 and 323 MHz (center). The images are on the same color scale and have an angular resolution of 12″ × 9″. Upper limits below −1.6 are outside the black contours and marked by arrows. The saturation scales inversely with the uncertainty on the spectral index. Right image: corresponding curvature map, defined as the difference ![]() .
.
Current usage metrics show cumulative count of Article Views (full-text article views including HTML views, PDF and ePub downloads, according to the available data) and Abstracts Views on Vision4Press platform.
Data correspond to usage on the plateform after 2015. The current usage metrics is available 48-96 hours after online publication and is updated daily on week days.
Initial download of the metrics may take a while.