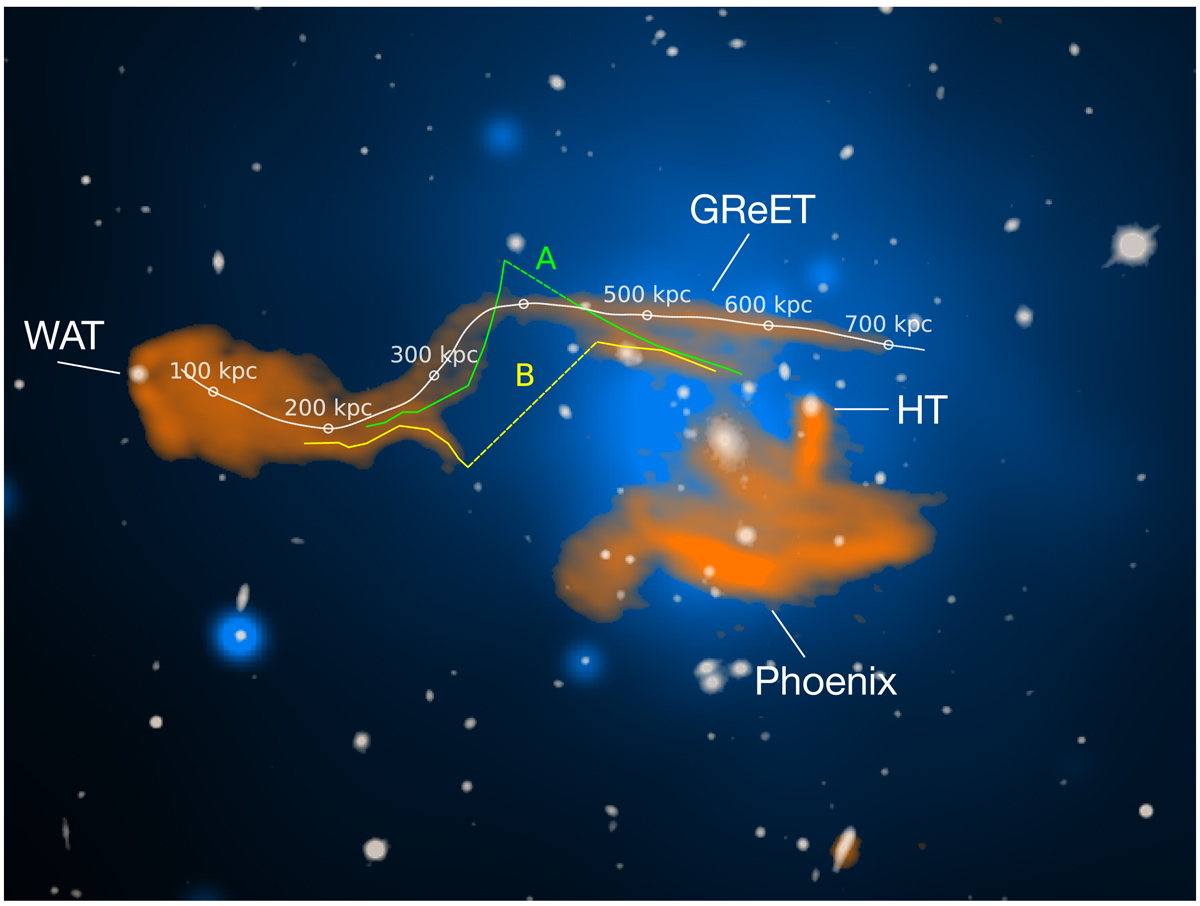
Fig. 2.
Download original image
Color-composite of the high-resolution LOFAR HBA (orange), the Chandra X-ray (blue) and the SDSS g (white, Alam et al. 2015) images. The white line corresponds to the path that is used to analyze the spectral properties of the GReET, and the dots mark the distance from the starting point in increments of 100 kpc. Paths A (green) and B (yellow) highlight the location of possible interrupted structures. The dashed section shows the discontinuity.
Current usage metrics show cumulative count of Article Views (full-text article views including HTML views, PDF and ePub downloads, according to the available data) and Abstracts Views on Vision4Press platform.
Data correspond to usage on the plateform after 2015. The current usage metrics is available 48-96 hours after online publication and is updated daily on week days.
Initial download of the metrics may take a while.