Open Access
Fig. C.1.
Download original image
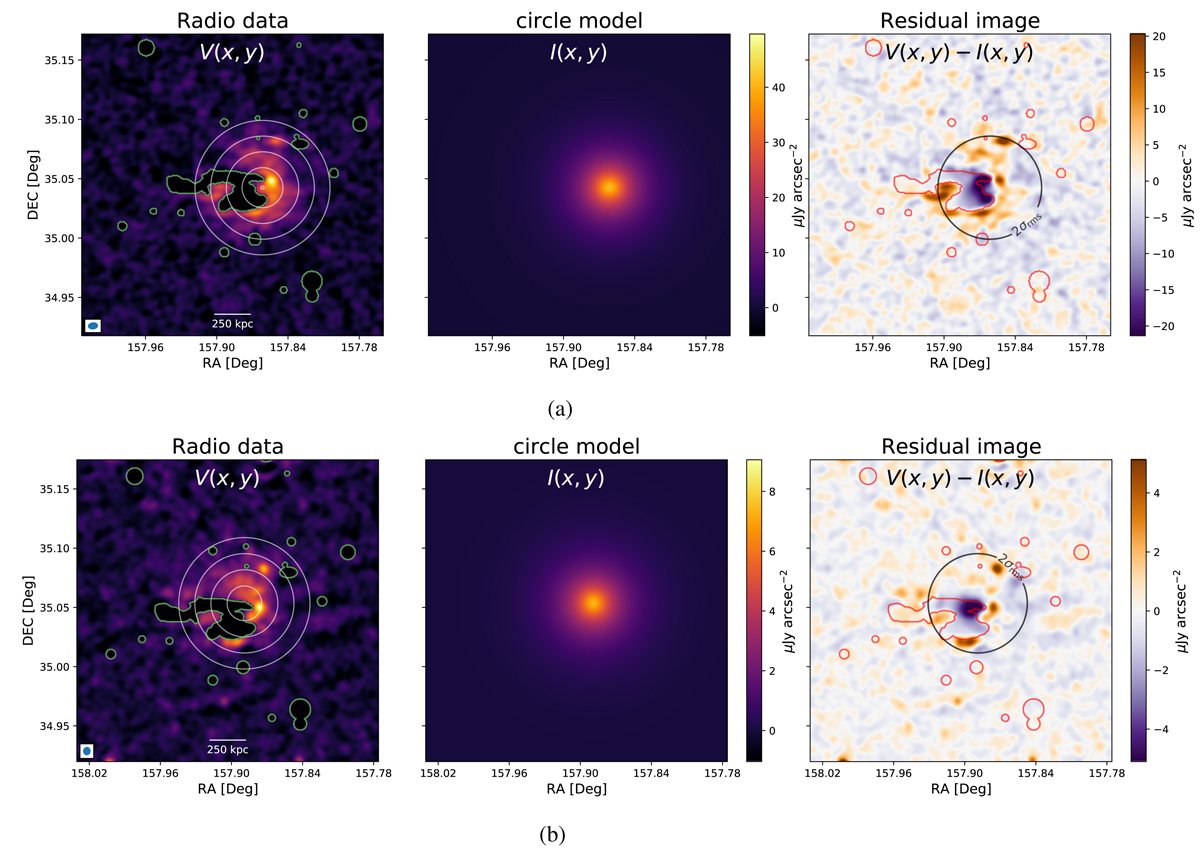
Results of the halo fitting in LBA (a) and HBA (b). The circles in the left panels indicate the position of the best-fit halo on top of the flux density maps. The center panels show the model, and the right panels present the residual. The green and red regions are excluded from the fitting.
Current usage metrics show cumulative count of Article Views (full-text article views including HTML views, PDF and ePub downloads, according to the available data) and Abstracts Views on Vision4Press platform.
Data correspond to usage on the plateform after 2015. The current usage metrics is available 48-96 hours after online publication and is updated daily on week days.
Initial download of the metrics may take a while.