Open Access
Fig. A.2.
Download original image
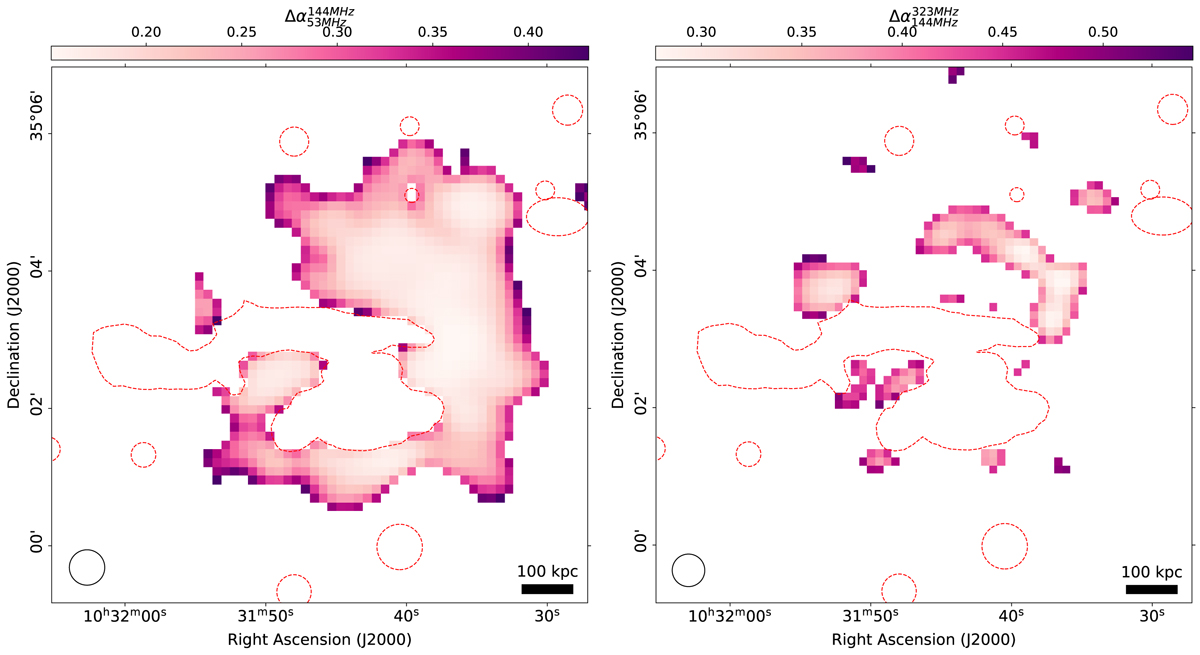
Source-subtracted spectral index uncertainty maps at a spatial resolution of 30″. The two figures are for the frequency ranges 54-144 MHz (left) and 144-323 MHz (right). Dashed red lines highlight the regions from which sources are subtracted.
Current usage metrics show cumulative count of Article Views (full-text article views including HTML views, PDF and ePub downloads, according to the available data) and Abstracts Views on Vision4Press platform.
Data correspond to usage on the plateform after 2015. The current usage metrics is available 48-96 hours after online publication and is updated daily on week days.
Initial download of the metrics may take a while.