Open Access
Fig. A.1.
Download original image
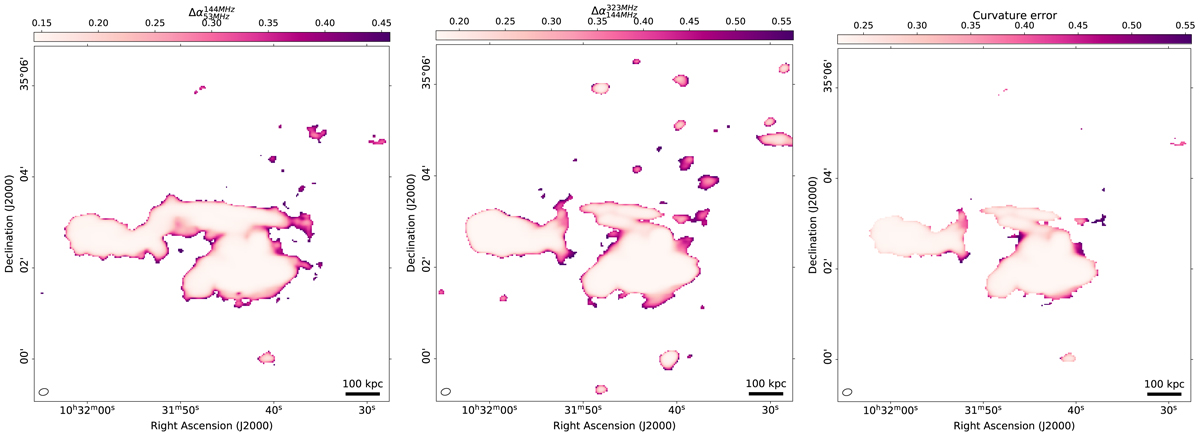
Uncertainty maps to Figure 3. The left and center figure show the spectral index uncertainties between 54-144 MHz (left) and 144-323 MHz (center). The right image shows the uncertainty of the curvature map.
Current usage metrics show cumulative count of Article Views (full-text article views including HTML views, PDF and ePub downloads, according to the available data) and Abstracts Views on Vision4Press platform.
Data correspond to usage on the plateform after 2015. The current usage metrics is available 48-96 hours after online publication and is updated daily on week days.
Initial download of the metrics may take a while.