Open Access
Fig. 5
Download original image
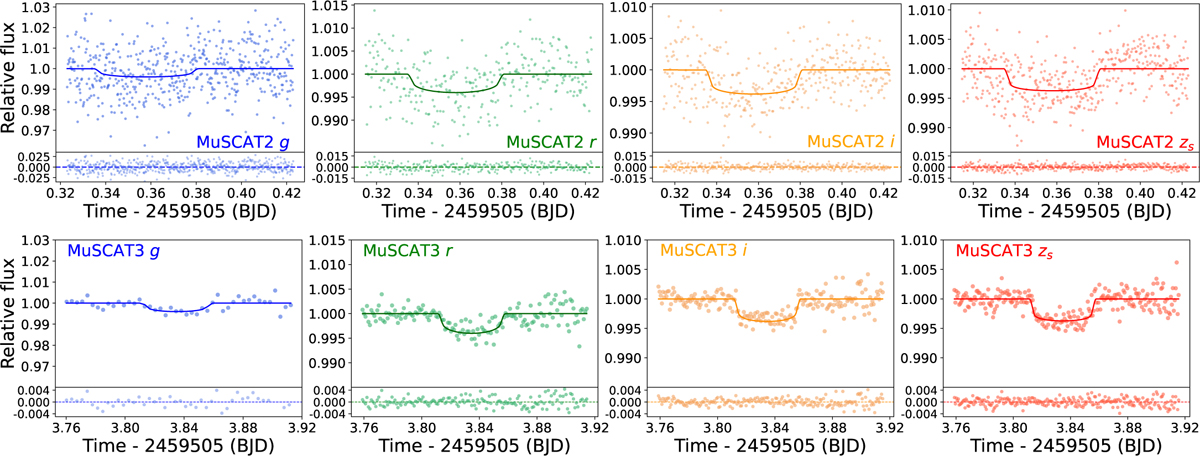
MuSCAT2 (top) and MUSCAT3 (bottom) detrended light curves of TOI-4479b in g, r, i, and zs passbands. The dots show the MuSCAT2 and MUSCAT3 relative flux and the lines show the best light-curve model from the MuSCAT2 pipeline for each band.
Current usage metrics show cumulative count of Article Views (full-text article views including HTML views, PDF and ePub downloads, according to the available data) and Abstracts Views on Vision4Press platform.
Data correspond to usage on the plateform after 2015. The current usage metrics is available 48-96 hours after online publication and is updated daily on week days.
Initial download of the metrics may take a while.