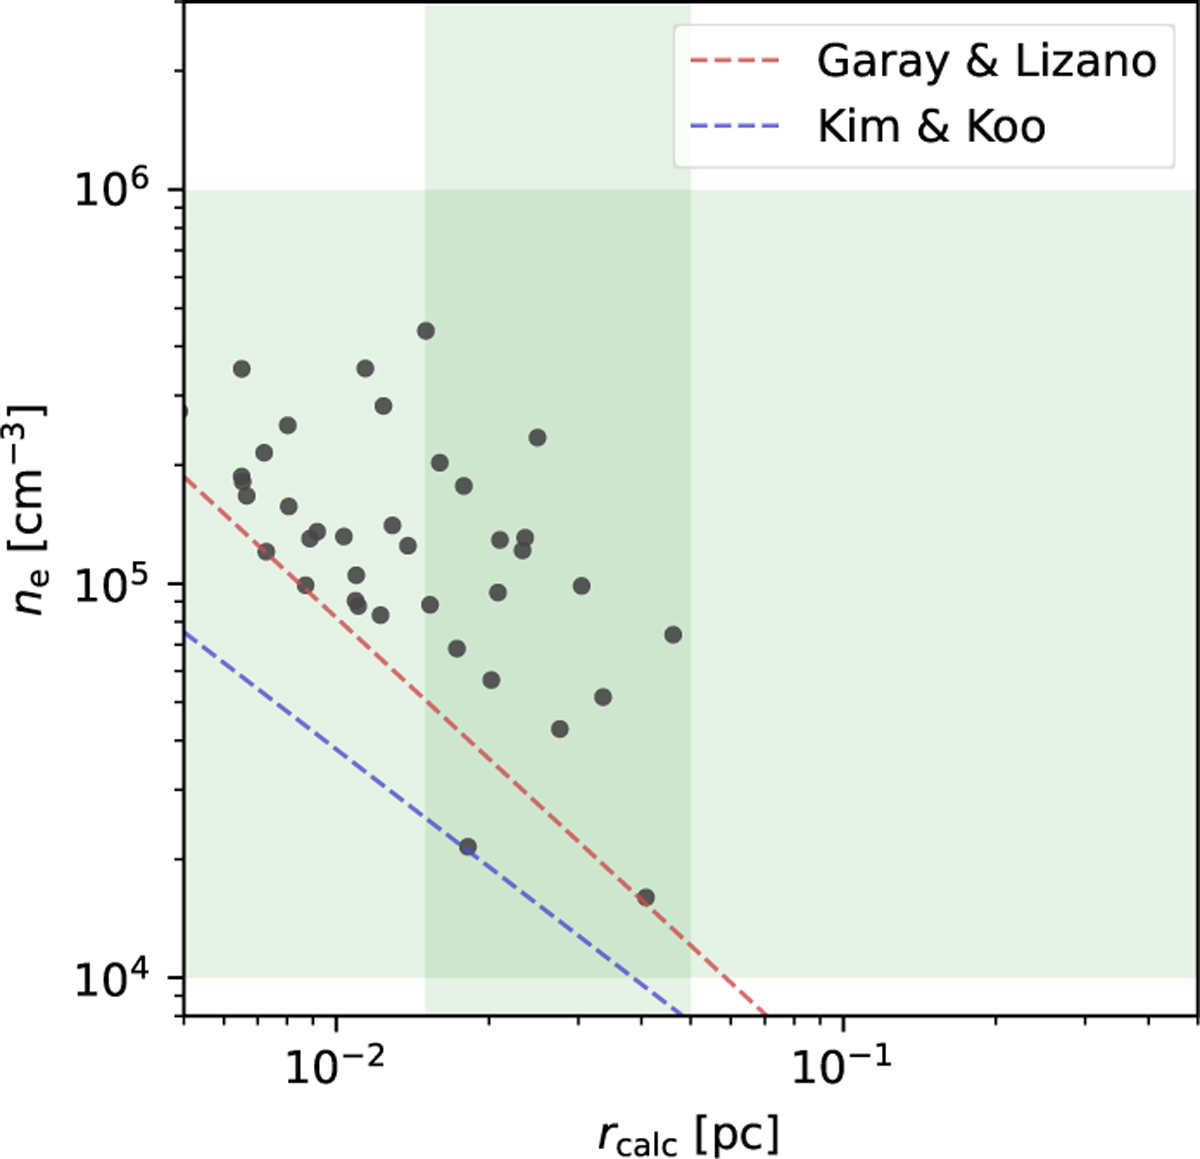
Fig. 8
Download original image
Diagram of rcalc and ne. Previously derived rcalc–ne relationships for UCHII regions from Garay & Lizano (1999), ne = 780 × (2r)−1.19, and from Kim & Koo (2001), ne = 790 × (2r)−∞, are plotted as dashed lines. The green shading indicates the typical ne of UCHII regions, which is from ~104 cm−3 to ~106 cm−3, and the typical r of UCHII regions, which is ~0.015 to ~0.05 pc (Kurtz 2005).
Current usage metrics show cumulative count of Article Views (full-text article views including HTML views, PDF and ePub downloads, according to the available data) and Abstracts Views on Vision4Press platform.
Data correspond to usage on the plateform after 2015. The current usage metrics is available 48-96 hours after online publication and is updated daily on week days.
Initial download of the metrics may take a while.