Fig. 1
Download original image
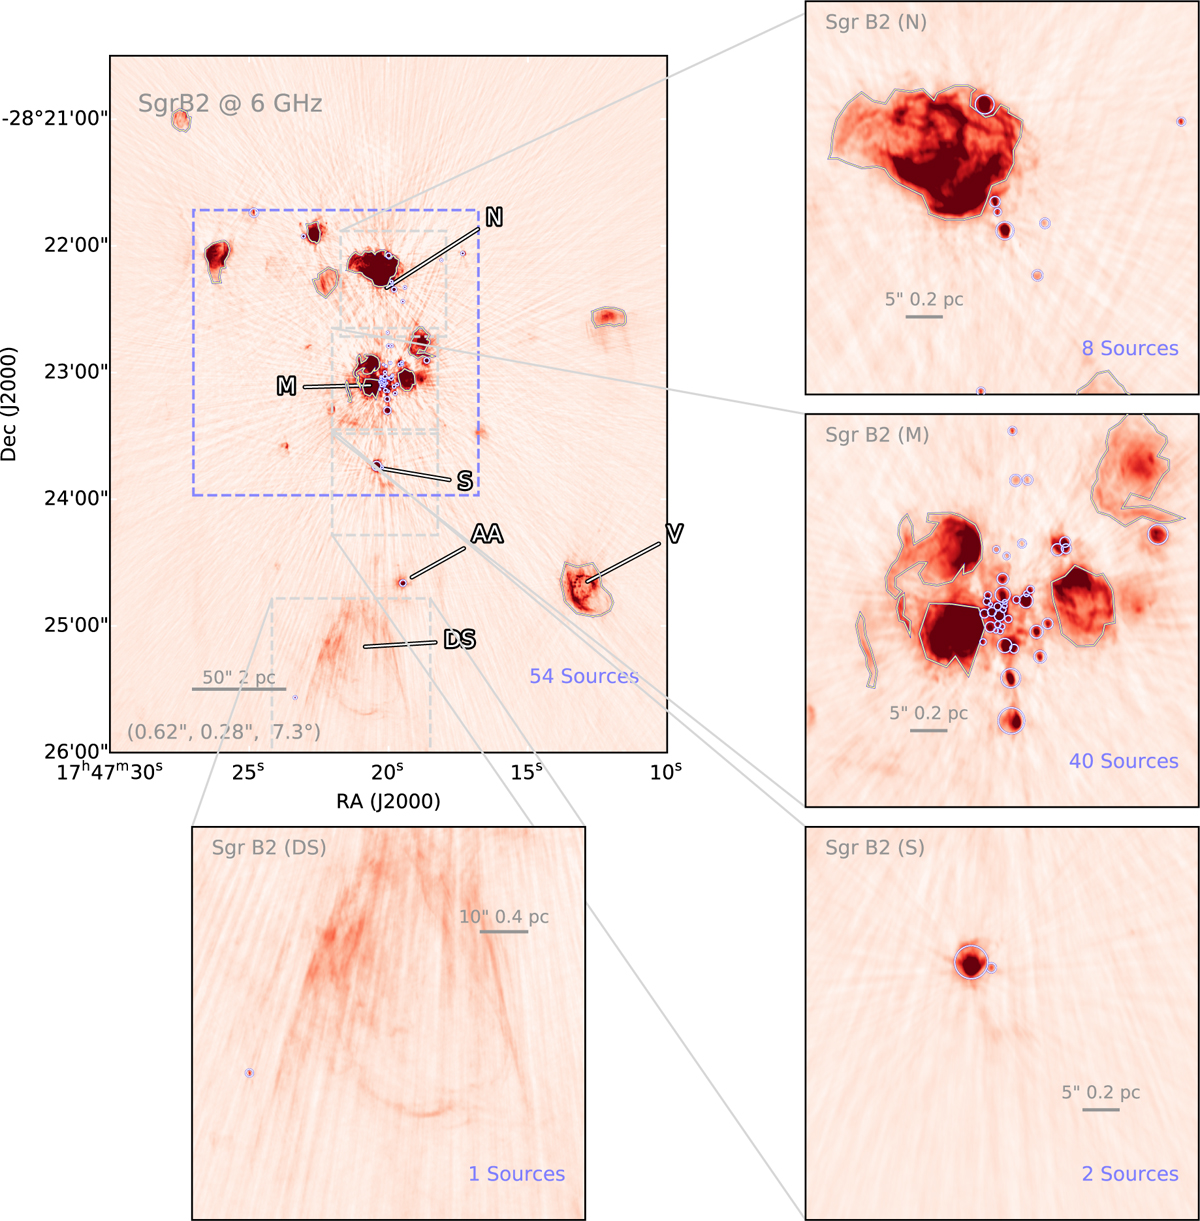
Sources identified in the 6 cm image. Those objects shown as white and blue circles have radii of robs6 (see Table B.1). Notable Hii regions are indicated. The Hii regions that are masked out for core identification are shown as white contours. The beam size is given in the lower left corner of the main panel (θmaj, θmin, PA). The spatial coverage of the 22.4 GHz image is shown as a blue dashed box.
Current usage metrics show cumulative count of Article Views (full-text article views including HTML views, PDF and ePub downloads, according to the available data) and Abstracts Views on Vision4Press platform.
Data correspond to usage on the plateform after 2015. The current usage metrics is available 48-96 hours after online publication and is updated daily on week days.
Initial download of the metrics may take a while.