Fig. 7
Download original image
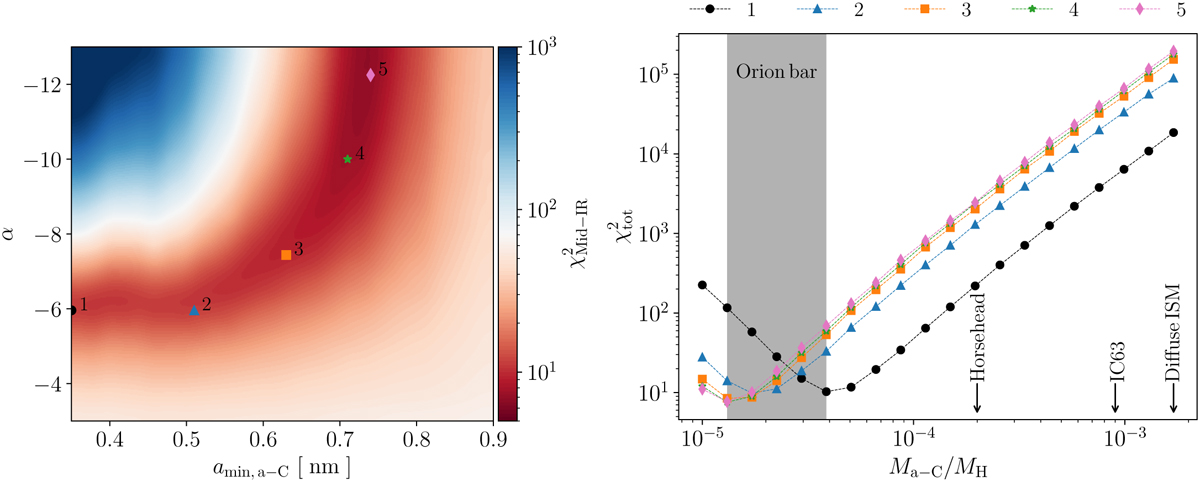
χ2 minimisation for the Orion Bar. Left: ![]() in the 2D space (amin,a–C and α). Right:
in the 2D space (amin,a–C and α). Right: ![]() as a function of Ma_c/MH for five different couple amin,a–C/α that are represented by the five symbols on the left figure. 1 (black dot): 0.35 nm/−5.96, 2 (blue triangle): 0.51 nm/−5.96. 3 (orange square): 0.63 nm/−7.44, 4 (green star): 0.71 nm/−8.92, 5 (pink diamond): 0.77 nm/−12.25. We also indicate with black arrows the Ma_c/MH obtained for the Horsehead (see Paper I), IC63 (see Sect. 5.2), and the diffuse ISM (Jones et al. 2013, 2017). The vertical grey stripe corresponds to the range of Ma_c/MH that minimise
as a function of Ma_c/MH for five different couple amin,a–C/α that are represented by the five symbols on the left figure. 1 (black dot): 0.35 nm/−5.96, 2 (blue triangle): 0.51 nm/−5.96. 3 (orange square): 0.63 nm/−7.44, 4 (green star): 0.71 nm/−8.92, 5 (pink diamond): 0.77 nm/−12.25. We also indicate with black arrows the Ma_c/MH obtained for the Horsehead (see Paper I), IC63 (see Sect. 5.2), and the diffuse ISM (Jones et al. 2013, 2017). The vertical grey stripe corresponds to the range of Ma_c/MH that minimise ![]() in the Orion Bar.
in the Orion Bar.
Current usage metrics show cumulative count of Article Views (full-text article views including HTML views, PDF and ePub downloads, according to the available data) and Abstracts Views on Vision4Press platform.
Data correspond to usage on the plateform after 2015. The current usage metrics is available 48-96 hours after online publication and is updated daily on week days.
Initial download of the metrics may take a while.